23 Hans St Cranston, RI 02910
Eden Park NeighborhoodEstimated Value: $384,000 - $435,000
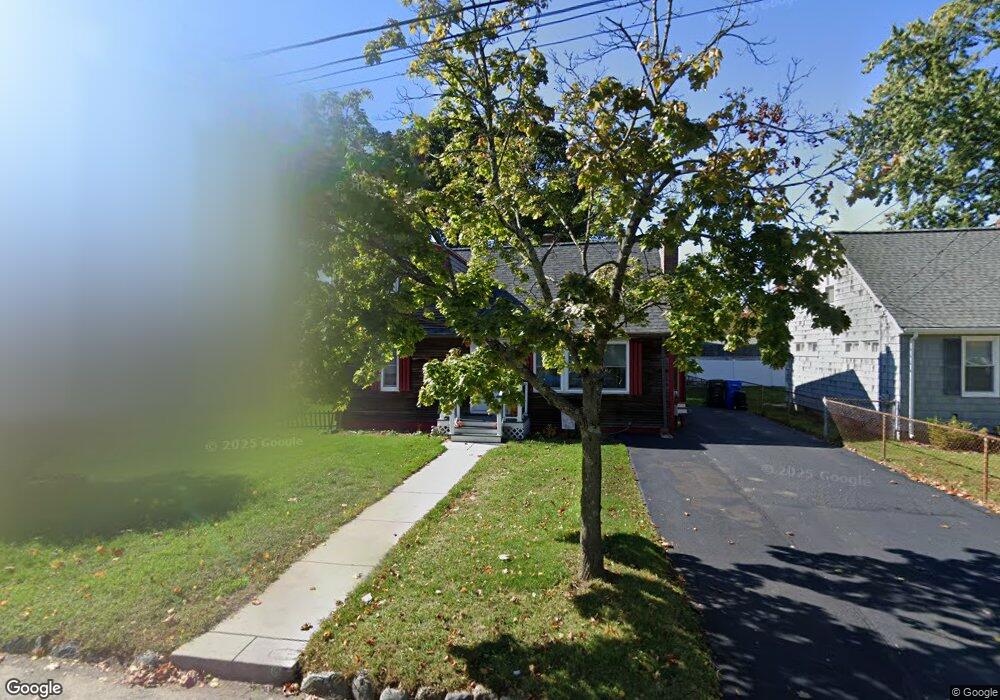
About This Home
This home is located at 23 Hans St, Cranston, RI 02910 and is currently estimated at $415,152, approximately $292 per square foot. 23 Hans St is a home located in Providence County with nearby schools including Park View Middle School, Cranston High School East, and Cadence Academy Preschool - Cranston.
Ownership History
We collect this data history from publicly available records. To have your information removed, we recommend requesting removal directly through your county’s website.
Purchase Details
Home Financials for this Owner
Home Financials are based on the most recent Mortgage that was taken out on this home.Purchase Details
Purchase Details
Home Values in the Area
Average Home Value in this Area
Purchase History
We collect this data history from publicly available records. To have your information removed, we recommend requesting removal directly through your county’s website.
| Date | Buyer | Sale Price | Title Company |
|---|---|---|---|
| $160,000 | -- | ||
| $202,500 | -- | ||
| $115,000 | -- | ||
| $115,000 | -- |
Mortgage History
We collect this data history from publicly available records. To have your information removed, we recommend requesting removal directly through your county’s website.
| Date | Status | Borrower | Loan Amount |
|---|---|---|---|
| Open | $150,000 | ||
| Closed | $152,000 |
Tax History
We collect this data history from publicly available records. To have your information removed, we recommend requesting removal directly through your county’s website.
| Year | Tax Paid | Tax Assessment Tax Assessment Total Assessment is a certain percentage of the fair market value that is determined by local assessors to be the total taxable value of land and additions on the property. | Land | Improvement |
|---|---|---|---|---|
| 2025 | $4,479 | $322,700 | $111,800 | $210,900 |
| 2024 | $4,392 | $322,700 | $111,800 | $210,900 |
| 2023 | $4,438 | $234,800 | $73,600 | $161,200 |
| 2022 | $4,346 | $234,800 | $73,600 | $161,200 |
| 2021 | $4,226 | $234,800 | $73,600 | $161,200 |
| 2020 | $4,004 | $192,800 | $70,100 | $122,700 |
| 2019 | $4,004 | $192,800 | $70,100 | $122,700 |
| 2018 | $3,912 | $192,800 | $70,100 | $122,700 |
| 2017 | $3,801 | $165,700 | $63,100 | $102,600 |
| 2016 | $3,720 | $165,700 | $63,100 | $102,600 |
| 2015 | $3,720 | $165,700 | $63,100 | $102,600 |
| 2014 | $3,670 | $160,700 | $63,100 | $97,600 |
Map
- 150 Riverside Ave
- 84 Ash Ave
- 72 Fairweather Ave
- 70 Holburn Ave
- 27 Hemlock Ave
- 41 Ash Ave
- 12 Hemlock Ave
- 44 Holburn Ave
- 9 Gardner Ave
- 21 Euston Ave
- 865 Pontiac Ave
- 685 Pontiac Ave
- 17 Forest Ave Unit 19
- 58 Davis Ave
- 0 Elmwood Ave
- 22 Waldron Ave
- 95 2nd Ave
- 34 Capuano Ave Unit A
- 205 Pawtuxet Ave
- 116 2nd Ave
- 34 Linden Ave
- 28 Linden Ave
- 147 Riverside Ave
- 27 Hans St
- 160 Riverside Ave
- 26 Linden Ave
- 170 Riverside Ave
- 175 Riverside Ave
- 166 Riverside Ave
- 144 Riverside Ave
- 19 Hans St
- 36 Hans St
- 14 Linden Ave
- 174 Riverside Ave
- 28 Hans St
- 185 Riverside Ave
- 136 Riverside Ave
- 13 Hans St
- 24 Hans St
- 182 Riverside Ave
Ask me questions while you tour the home.