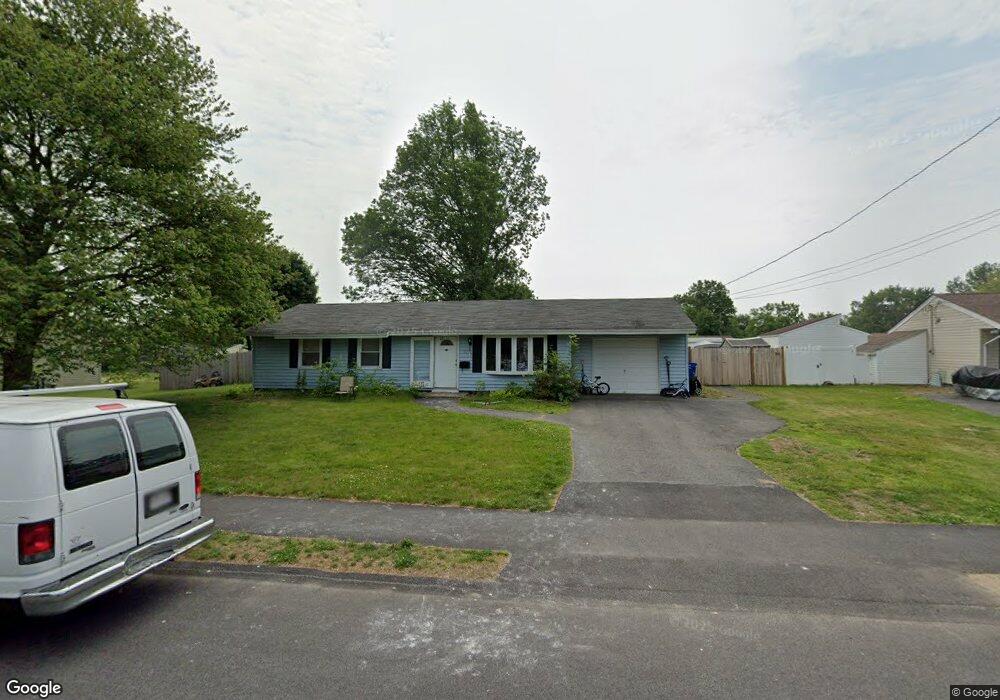
23 Heath St Brockton, MA 02302
Estimated Value: $451,000 - $491,000
3
Beds
1
Bath
1,177
Sq Ft
$397/Sq Ft
Est. Value
About This Home
This home is located at 23 Heath St, Brockton, MA 02302 and is currently estimated at $467,435, approximately $397 per square foot. 23 Heath St is a home located in Plymouth County with nearby schools including Davis K-8 School, John F. Kennedy Elementary School, and South Middle School.
Ownership History
Date
Name
Owned For
Owner Type
Purchase Details
Closed on
Sep 23, 2011
Sold by
Benson Leo E
Bought by
Nolan Kevin F and Nolan Laura
Current Estimated Value
Home Financials for this Owner
Home Financials are based on the most recent Mortgage that was taken out on this home.
Original Mortgage
$175,437
Outstanding Balance
$120,939
Interest Rate
4.4%
Mortgage Type
FHA
Estimated Equity
$346,496
Create a Home Valuation Report for This Property
The Home Valuation Report is an in-depth analysis detailing your home's value as well as a comparison with similar homes in the area
Home Values in the Area
Average Home Value in this Area
Purchase History
| Date | Buyer | Sale Price | Title Company |
|---|---|---|---|
| Nolan Kevin F | $180,000 | -- |
Source: Public Records
Mortgage History
| Date | Status | Borrower | Loan Amount |
|---|---|---|---|
| Open | Nolan Kevin F | $175,437 |
Source: Public Records
Tax History Compared to Growth
Tax History
| Year | Tax Paid | Tax Assessment Tax Assessment Total Assessment is a certain percentage of the fair market value that is determined by local assessors to be the total taxable value of land and additions on the property. | Land | Improvement |
|---|---|---|---|---|
| 2025 | $4,456 | $368,000 | $160,900 | $207,100 |
| 2024 | $4,395 | $365,600 | $160,900 | $204,700 |
| 2023 | $4,173 | $321,500 | $111,300 | $210,200 |
| 2022 | $4,085 | $292,400 | $101,100 | $191,300 |
| 2021 | $3,824 | $263,700 | $94,100 | $169,600 |
| 2020 | $4,072 | $268,800 | $82,500 | $186,300 |
| 2019 | $3,590 | $231,000 | $78,900 | $152,100 |
| 2018 | $3,228 | $201,000 | $78,900 | $122,100 |
| 2017 | $3,061 | $190,100 | $78,900 | $111,200 |
| 2016 | $3,149 | $181,400 | $75,200 | $106,200 |
| 2015 | $3,135 | $172,700 | $75,200 | $97,500 |
| 2014 | $3,084 | $170,100 | $75,200 | $94,900 |
Source: Public Records
Map
Nearby Homes