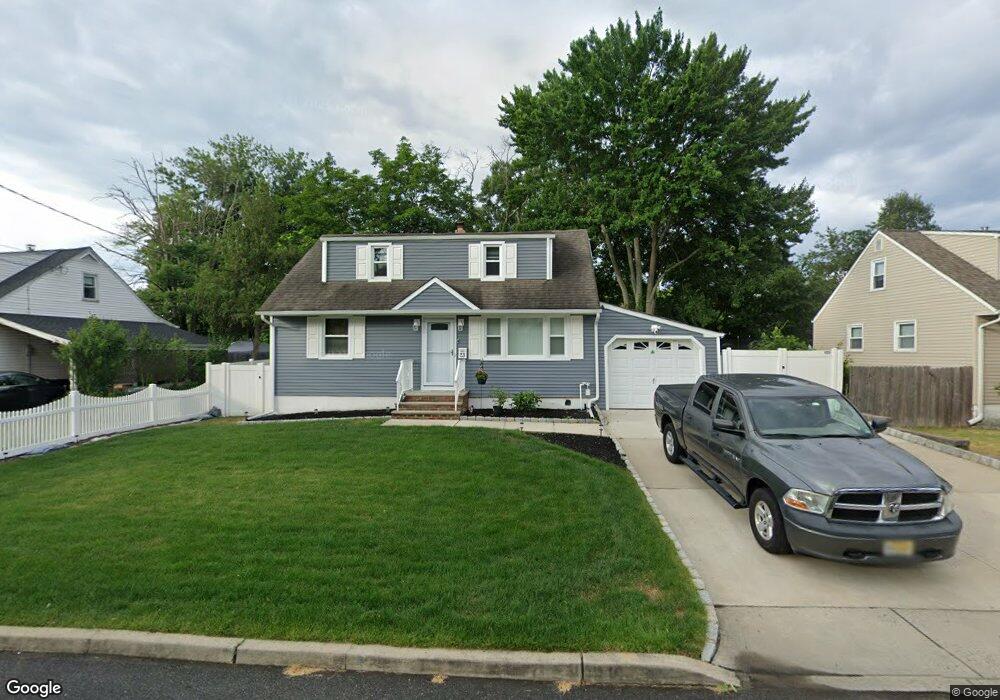
23 Hilliard Rd Old Bridge, NJ 08857
Estimated Value: $355,000 - $504,000
4
Beds
1
Bath
1,220
Sq Ft
$372/Sq Ft
Est. Value
About This Home
This home is located at 23 Hilliard Rd, Old Bridge, NJ 08857 and is currently estimated at $454,179, approximately $372 per square foot. 23 Hilliard Rd is a home located in Middlesex County with nearby schools including Old Bridge High School and St. Thomas the Apostle School.
Ownership History
Date
Name
Owned For
Owner Type
Purchase Details
Closed on
Apr 20, 2023
Sold by
Reiner Mary
Bought by
Colleran Thomas J
Current Estimated Value
Purchase Details
Closed on
Jul 19, 2016
Sold by
Miller Frederick F and Miller Frederick F
Bought by
Colleran Thomas and Reiner Mary
Home Financials for this Owner
Home Financials are based on the most recent Mortgage that was taken out on this home.
Original Mortgage
$211,850
Interest Rate
3.56%
Mortgage Type
New Conventional
Create a Home Valuation Report for This Property
The Home Valuation Report is an in-depth analysis detailing your home's value as well as a comparison with similar homes in the area
Home Values in the Area
Average Home Value in this Area
Purchase History
| Date | Buyer | Sale Price | Title Company |
|---|---|---|---|
| Colleran Thomas J | $182,379 | Chicago Title | |
| Colleran Thomas J | $182,379 | Chicago Title | |
| Colleran Thomas | $223,000 | New Choice Title Agency |
Source: Public Records
Mortgage History
| Date | Status | Borrower | Loan Amount |
|---|---|---|---|
| Previous Owner | Colleran Thomas | $211,850 |
Source: Public Records
Tax History
| Year | Tax Paid | Tax Assessment Tax Assessment Total Assessment is a certain percentage of the fair market value that is determined by local assessors to be the total taxable value of land and additions on the property. | Land | Improvement |
|---|---|---|---|---|
| 2025 | $6,816 | $120,700 | $45,000 | $75,700 |
| 2024 | $6,538 | $120,700 | $45,000 | $75,700 |
Source: Public Records
Map
Nearby Homes
- 1283 Englishtown Rd
- 45 Piersoll Rd
- 14 Brookside Ave
- 1299 Englishtown Rd
- 30 Arvin Rd
- 34 Brookside Ave
- 1210 Englishtown Rd
- 98 Madison Ave
- 21 Pine St
- 35 Birch St
- 24 Kensington Ave
- 14 Andover Rd
- 18 Andover Rd
- 1122 Marlboro Rd
- 23 Orchard Dr
- 21 Fourth St
- 931 Englishtown Rd
- 132 Southwood Dr
- 857 Englishtown Rd
- 2 Michael Ct
Your Personal Tour Guide
Ask me questions while you tour the home.