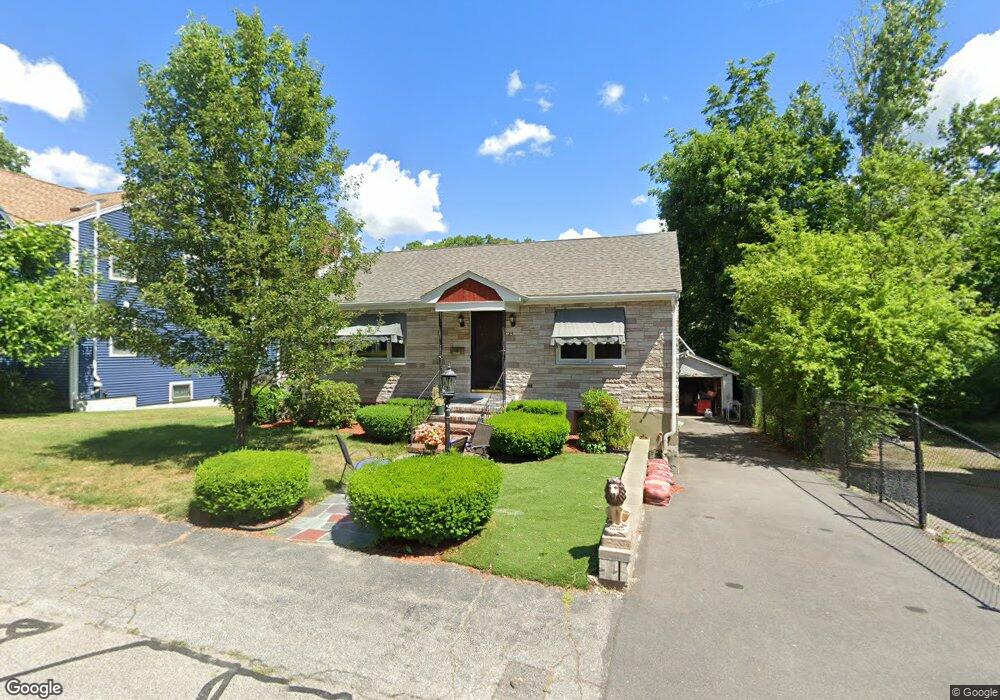
23 Howland St Needham, MA 02492
Estimated Value: $901,000 - $1,134,000
2
Beds
2
Baths
1,448
Sq Ft
$704/Sq Ft
Est. Value
About This Home
This home is located at 23 Howland St, Needham, MA 02492 and is currently estimated at $1,019,511, approximately $704 per square foot. 23 Howland St is a home located in Norfolk County with nearby schools including Newman Elementary School, High Rock Middle School, and Pollard Middle School.
Ownership History
Date
Name
Owned For
Owner Type
Purchase Details
Closed on
Jan 23, 2008
Sold by
Howland Street Rt and Gallello Salvatore
Bought by
Gallello Salvatore
Current Estimated Value
Home Financials for this Owner
Home Financials are based on the most recent Mortgage that was taken out on this home.
Original Mortgage
$160,000
Outstanding Balance
$101,048
Interest Rate
6.17%
Mortgage Type
Purchase Money Mortgage
Estimated Equity
$918,463
Create a Home Valuation Report for This Property
The Home Valuation Report is an in-depth analysis detailing your home's value as well as a comparison with similar homes in the area
Home Values in the Area
Average Home Value in this Area
Purchase History
| Date | Buyer | Sale Price | Title Company |
|---|---|---|---|
| Gallello Salvatore | -- | -- |
Source: Public Records
Mortgage History
| Date | Status | Borrower | Loan Amount |
|---|---|---|---|
| Open | Gallello Salvatore | $160,000 |
Source: Public Records
Tax History
| Year | Tax Paid | Tax Assessment Tax Assessment Total Assessment is a certain percentage of the fair market value that is determined by local assessors to be the total taxable value of land and additions on the property. | Land | Improvement |
|---|---|---|---|---|
| 2025 | $8,608 | $812,100 | $590,900 | $221,200 |
| 2024 | $7,603 | $607,300 | $429,200 | $178,100 |
| 2023 | $7,746 | $594,000 | $429,200 | $164,800 |
| 2022 | $7,428 | $555,600 | $397,300 | $158,300 |
| 2021 | $7,239 | $555,600 | $397,300 | $158,300 |
| 2020 | $6,680 | $534,800 | $397,300 | $137,500 |
| 2019 | $6,174 | $498,300 | $361,200 | $137,100 |
| 2018 | $5,920 | $498,300 | $361,200 | $137,100 |
| 2017 | $5,707 | $480,000 | $361,200 | $118,800 |
| 2016 | $5,539 | $480,000 | $361,200 | $118,800 |
| 2015 | $5,419 | $480,000 | $361,200 | $118,800 |
| 2014 | $5,006 | $430,100 | $314,000 | $116,100 |
Source: Public Records
Map
Nearby Homes
- 971 Webster St
- 1011 Webster St
- 1034 Webster St
- 60 Sutton Rd
- 150 Laurel Dr
- 18 Grant St Unit 2
- 34 Lincoln St Unit 34
- 133 Prince St
- 126 Prince St
- 383 Manning St
- 36 Otis St Unit 36
- 75 High Rock St
- 2 Denmark Ln Unit 2
- 569 Chestnut St
- 193 Garden St
- 674 Webster St
- 287 High Rock St
- 31 Birds Hill Ave
- 19 Oakland Ave Unit 19
- 53 Heather Ln
- 19 Howland St
- 29 Howland St
- 30 Howland St
- 983 Webster St
- 981 Webster St
- 981 Webster St Unit 981
- 39 Howland St
- 967 Webster St
- 36 Howland St
- 989 Webster St
- 961 Webster St
- 40 Howland St Unit 1
- 40 Howland St
- 40 Howland St
- 40 Howland St Unit 40
- 40 Howland St Unit 2
- 45 Howland St
- 22 Heath St
- 42 Howland St
- 44 Howland St
Your Personal Tour Guide
Ask me questions while you tour the home.