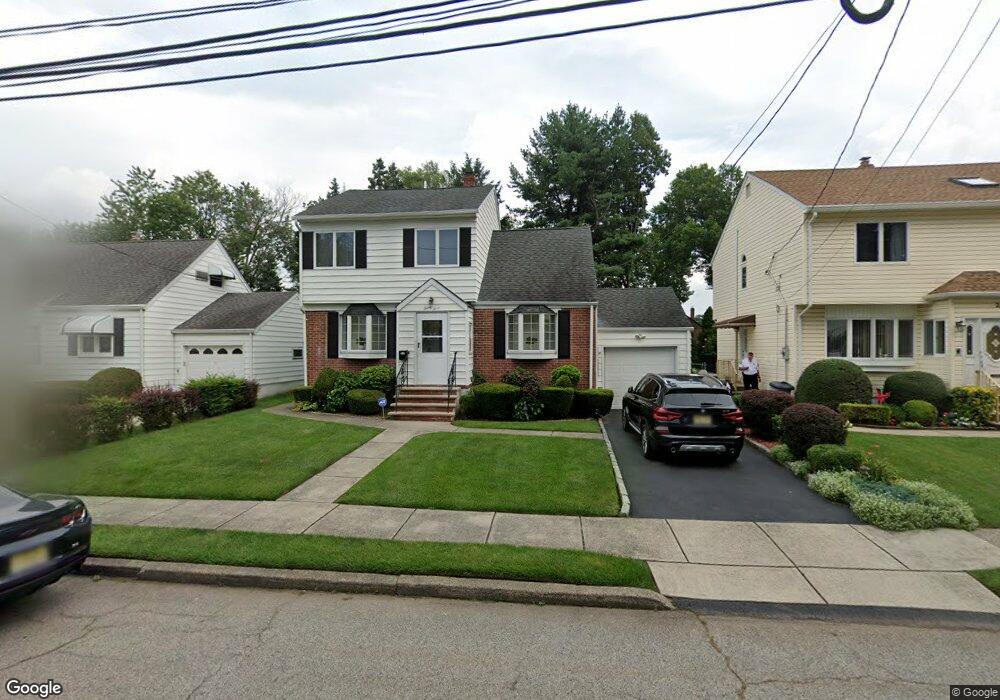
23 Hugo St Clifton, NJ 07012
Allwood NeighborhoodEstimated Value: $564,391 - $638,000
--
Bed
--
Bath
1,411
Sq Ft
$427/Sq Ft
Est. Value
About This Home
This home is located at 23 Hugo St, Clifton, NJ 07012 and is currently estimated at $601,848, approximately $426 per square foot. 23 Hugo St is a home located in Passaic County with nearby schools including Clifton High School, St Andrew Elementary School, and St Clare Elementary School.
Ownership History
Date
Name
Owned For
Owner Type
Purchase Details
Closed on
Feb 25, 2003
Sold by
Smallheer Joe
Bought by
Lee Susan
Current Estimated Value
Home Financials for this Owner
Home Financials are based on the most recent Mortgage that was taken out on this home.
Original Mortgage
$259,000
Outstanding Balance
$109,928
Interest Rate
5.95%
Estimated Equity
$491,920
Purchase Details
Closed on
Jun 15, 2000
Sold by
Super John and Pokrywa Nancy
Bought by
Smallheer Joseph and Smallheer Mylene
Home Financials for this Owner
Home Financials are based on the most recent Mortgage that was taken out on this home.
Original Mortgage
$196,650
Interest Rate
8.1%
Create a Home Valuation Report for This Property
The Home Valuation Report is an in-depth analysis detailing your home's value as well as a comparison with similar homes in the area
Home Values in the Area
Average Home Value in this Area
Purchase History
| Date | Buyer | Sale Price | Title Company |
|---|---|---|---|
| Lee Susan | $289,000 | -- | |
| Smallheer Joseph | $207,000 | -- |
Source: Public Records
Mortgage History
| Date | Status | Borrower | Loan Amount |
|---|---|---|---|
| Open | Lee Susan | $259,000 | |
| Previous Owner | Smallheer Joseph | $196,650 |
Source: Public Records
Tax History Compared to Growth
Tax History
| Year | Tax Paid | Tax Assessment Tax Assessment Total Assessment is a certain percentage of the fair market value that is determined by local assessors to be the total taxable value of land and additions on the property. | Land | Improvement |
|---|---|---|---|---|
| 2025 | $10,507 | $177,000 | $90,600 | $86,400 |
| 2024 | $10,255 | $177,000 | $90,600 | $86,400 |
| 2022 | $10,107 | $177,000 | $90,600 | $86,400 |
| 2021 | $9,691 | $177,000 | $90,600 | $86,400 |
| 2020 | $9,723 | $177,000 | $90,600 | $86,400 |
| 2019 | $9,654 | $177,000 | $90,600 | $86,400 |
| 2018 | $9,599 | $177,000 | $90,600 | $86,400 |
| 2017 | $9,494 | $177,000 | $90,600 | $86,400 |
| 2016 | $9,310 | $177,000 | $90,600 | $86,400 |
| 2015 | $9,220 | $177,000 | $90,600 | $86,400 |
| 2014 | $9,031 | $177,000 | $90,600 | $86,400 |
Source: Public Records
Map
Nearby Homes