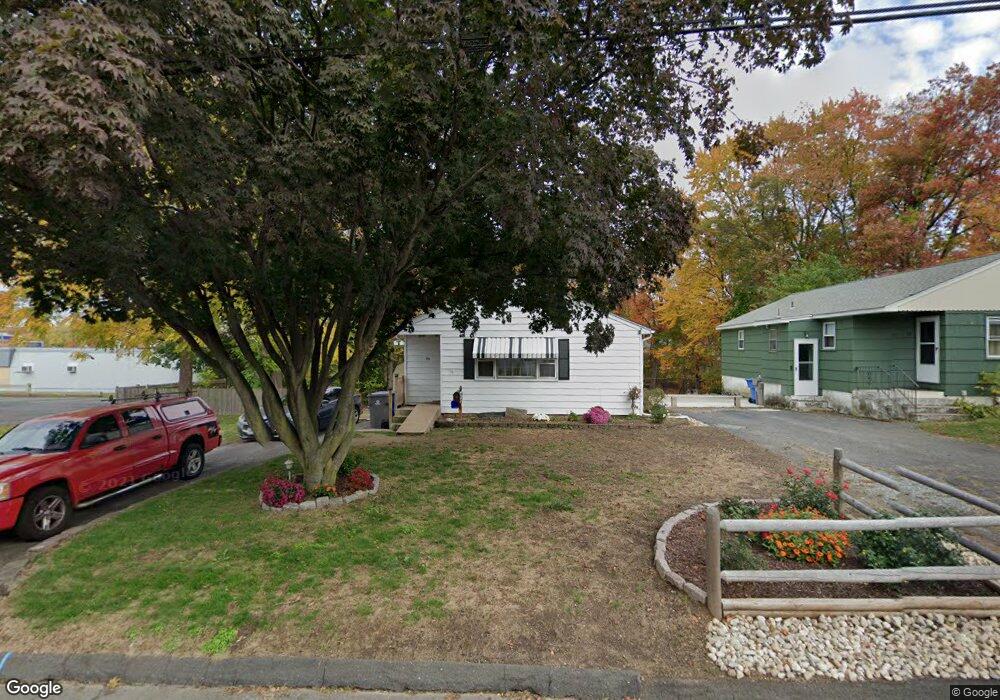
23 John Ave Bristol, CT 06010
Forestville NeighborhoodEstimated Value: $285,000 - $317,617
2
Beds
1
Bath
1,072
Sq Ft
$277/Sq Ft
Est. Value
About This Home
This home is located at 23 John Ave, Bristol, CT 06010 and is currently estimated at $297,404, approximately $277 per square foot. 23 John Ave is a home located in Hartford County with nearby schools including Stafford School, Chippens Hill Middle School, and Bristol Eastern High School.
Ownership History
Date
Name
Owned For
Owner Type
Purchase Details
Closed on
Jan 28, 1993
Sold by
Rousseau Martha M Est
Bought by
Duncan Jerry and Duncan Diane C
Current Estimated Value
Home Financials for this Owner
Home Financials are based on the most recent Mortgage that was taken out on this home.
Original Mortgage
$91,125
Interest Rate
8%
Mortgage Type
Unknown
Create a Home Valuation Report for This Property
The Home Valuation Report is an in-depth analysis detailing your home's value as well as a comparison with similar homes in the area
Home Values in the Area
Average Home Value in this Area
Purchase History
| Date | Buyer | Sale Price | Title Company |
|---|---|---|---|
| Duncan Jerry | $90,000 | -- | |
| Duncan Jerry | $90,000 | -- |
Source: Public Records
Mortgage History
| Date | Status | Borrower | Loan Amount |
|---|---|---|---|
| Previous Owner | Duncan Jerry | $83,000 | |
| Previous Owner | Duncan Jerry | $91,125 |
Source: Public Records
Tax History
| Year | Tax Paid | Tax Assessment Tax Assessment Total Assessment is a certain percentage of the fair market value that is determined by local assessors to be the total taxable value of land and additions on the property. | Land | Improvement |
|---|---|---|---|---|
| 2025 | $4,985 | $147,700 | $43,050 | $104,650 |
| 2024 | $4,720 | $148,190 | $43,050 | $105,140 |
| 2023 | $4,498 | $148,190 | $43,050 | $105,140 |
| 2022 | $4,121 | $107,450 | $34,930 | $72,520 |
| 2021 | $4,121 | $107,450 | $34,930 | $72,520 |
| 2020 | $4,121 | $107,450 | $34,930 | $72,520 |
| 2019 | $4,088 | $107,450 | $34,930 | $72,520 |
| 2018 | $3,963 | $107,450 | $34,930 | $72,520 |
| 2017 | $3,879 | $107,660 | $43,400 | $64,260 |
| 2016 | $3,879 | $107,660 | $43,400 | $64,260 |
| 2015 | $3,726 | $107,660 | $43,400 | $64,260 |
| 2014 | $3,726 | $107,660 | $43,400 | $64,260 |
Source: Public Records
Map
Nearby Homes
- 941 Farmington Ave
- 81 Lancaster Rd
- 64 Fanway Ave
- 20 Westchester Dr
- 30 Adeline Ave
- 169 Morningside Dr E
- 55 Beths Ave Unit 77
- 66 Beths Ave Unit 15
- 79 Beths Ave Unit 100
- 3 Sandra St
- 63 Jerome Ave
- 135 Jerome Ave
- 175 Moody St
- 225 Stonecrest Dr
- 92 Garfield Rd
- 97 Jacqueline Dr
- 179 Mark St
- 1325 Farmington Ave Unit 52
- 115 Daniel Rd
- 35 Jasmine St
Your Personal Tour Guide
Ask me questions while you tour the home.