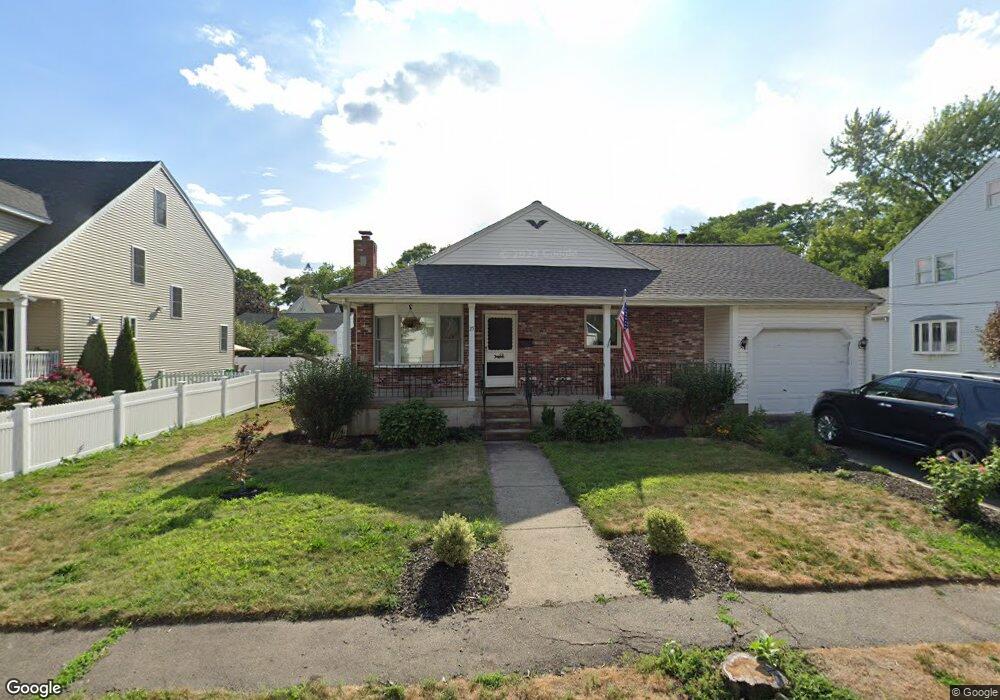
23 John St Quincy, MA 02171
Montclair NeighborhoodEstimated Value: $611,000 - $807,000
3
Beds
2
Baths
1,419
Sq Ft
$509/Sq Ft
Est. Value
About This Home
This home is located at 23 John St, Quincy, MA 02171 and is currently estimated at $722,205, approximately $508 per square foot. 23 John St is a home located in Norfolk County with nearby schools including Montclair Elementary School, Atlantic Middle School, and North Quincy High School.
Ownership History
Date
Name
Owned For
Owner Type
Purchase Details
Closed on
Nov 17, 1986
Bought by
Rogers Ronald A
Current Estimated Value
Create a Home Valuation Report for This Property
The Home Valuation Report is an in-depth analysis detailing your home's value as well as a comparison with similar homes in the area
Home Values in the Area
Average Home Value in this Area
Purchase History
| Date | Buyer | Sale Price | Title Company |
|---|---|---|---|
| Rogers Ronald A | $25,000 | -- |
Source: Public Records
Tax History
| Year | Tax Paid | Tax Assessment Tax Assessment Total Assessment is a certain percentage of the fair market value that is determined by local assessors to be the total taxable value of land and additions on the property. | Land | Improvement |
|---|---|---|---|---|
| 2025 | $7,595 | $658,700 | $390,600 | $268,100 |
| 2024 | $7,394 | $656,100 | $390,600 | $265,500 |
| 2023 | $7,186 | $645,600 | $372,000 | $273,600 |
| 2022 | $7,117 | $594,100 | $323,500 | $270,600 |
| 2021 | $6,705 | $552,300 | $308,000 | $244,300 |
| 2020 | $6,712 | $540,000 | $308,000 | $232,000 |
| 2019 | $6,492 | $517,300 | $287,900 | $229,400 |
| 2018 | $6,331 | $474,600 | $266,500 | $208,100 |
| 2017 | $6,170 | $435,400 | $253,900 | $181,500 |
| 2016 | $5,593 | $389,500 | $220,800 | $168,700 |
| 2015 | $5,180 | $354,800 | $200,800 | $154,000 |
| 2014 | $4,999 | $336,400 | $191,200 | $145,200 |
Source: Public Records
Map
Nearby Homes
- 115 W Squantum St Unit 517
- 115 W Squantum St Unit 203
- 115 W Squantum St Unit 811
- 100 W Squantum St Unit 411
- 54 Safford St
- 17 Holmes St Unit 204
- 17 Holmes St Unit 2
- 17 Holmes St Unit 1
- 98 Safford St
- 107 Fayette St
- 85 Myrtle St Unit 106
- 70 Walnut St
- 85 E Squantum St Unit 10
- 154 N Central Ave
- 135 E Squantum St
- 10 Weston Ave Unit 322
- 133 Commander Shea Blvd Unit 502
- 133 Commander Shea Blvd Unit 709
- 133 Commander Shea Blvd Unit 219
- 267-269 Farrington St
- 17 John St
- 27 John St
- 14 Division St
- 22 Division St
- 28 John St
- 24 John St
- 31 John St
- 31 John St Unit 1
- 6 Division St Unit 5
- 6 Division St Unit 4
- 6 Division St Unit 3
- 6 Division St Unit 2
- 6 Division St Unit 1
- 18 John St
- 6 Division Unit 5
- 5 John St
- 36 John St Unit 2
- 36 John St
- 28 Division St
- 3 Vincent Place Unit 1
Your Personal Tour Guide
Ask me questions while you tour the home.