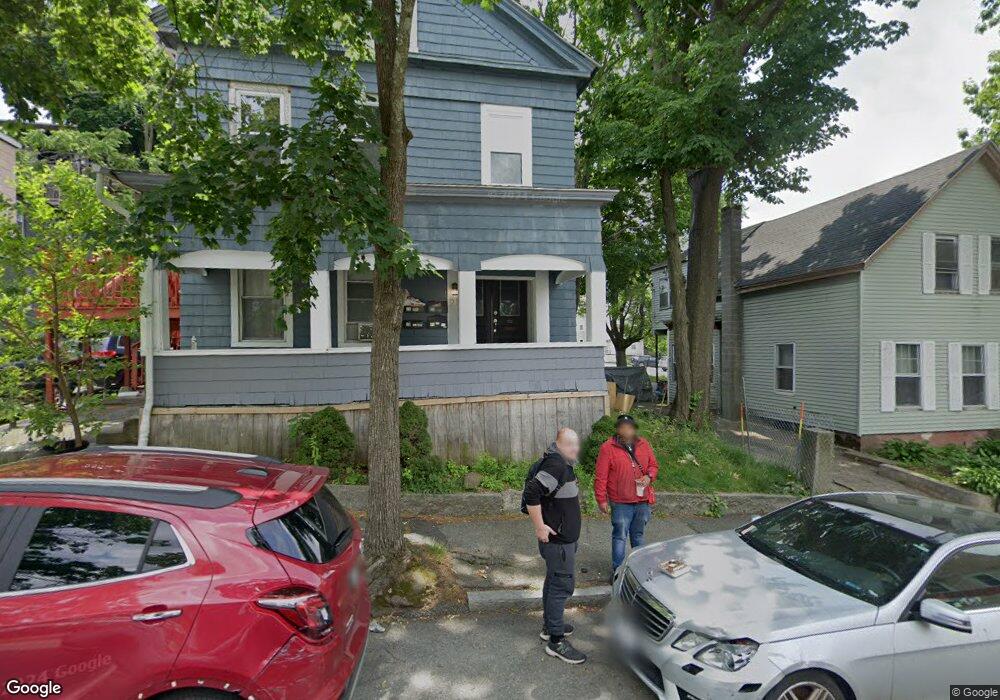
23 John St Worcester, MA 01609
Elm Park NeighborhoodEstimated Value: $324,271 - $416,000
4
Beds
1
Bath
1,446
Sq Ft
$256/Sq Ft
Est. Value
About This Home
This home is located at 23 John St, Worcester, MA 01609 and is currently estimated at $370,568, approximately $256 per square foot. 23 John St is a home located in Worcester County with nearby schools including Jacob Hiatt Magnet School, Chandler Magnet, and Elm Park Elementary School.
Ownership History
Date
Name
Owned For
Owner Type
Purchase Details
Closed on
Sep 10, 2007
Sold by
Ekeson Ifeanyi P and Ekeson Juliana E
Bought by
Ekeson Juliana E and Ekeson Philip I
Current Estimated Value
Home Financials for this Owner
Home Financials are based on the most recent Mortgage that was taken out on this home.
Original Mortgage
$165,000
Outstanding Balance
$105,373
Interest Rate
6.74%
Mortgage Type
Purchase Money Mortgage
Estimated Equity
$265,195
Purchase Details
Closed on
Oct 20, 1989
Sold by
Defresne Deborah
Bought by
Ekeson Ifeanyi
Home Financials for this Owner
Home Financials are based on the most recent Mortgage that was taken out on this home.
Original Mortgage
$80,000
Interest Rate
10.06%
Mortgage Type
Purchase Money Mortgage
Create a Home Valuation Report for This Property
The Home Valuation Report is an in-depth analysis detailing your home's value as well as a comparison with similar homes in the area
Home Values in the Area
Average Home Value in this Area
Purchase History
| Date | Buyer | Sale Price | Title Company |
|---|---|---|---|
| Ekeson Juliana E | -- | -- | |
| Ekeson Ifeanyi | $81,500 | -- |
Source: Public Records
Mortgage History
| Date | Status | Borrower | Loan Amount |
|---|---|---|---|
| Open | Ekeson Juliana E | $165,000 | |
| Previous Owner | Ekeson Ifeanyi | $116,000 | |
| Previous Owner | Ekeson Ifeanyi | $77,000 | |
| Previous Owner | Ekeson Ifeanyi | $80,000 |
Source: Public Records
Tax History
| Year | Tax Paid | Tax Assessment Tax Assessment Total Assessment is a certain percentage of the fair market value that is determined by local assessors to be the total taxable value of land and additions on the property. | Land | Improvement |
|---|---|---|---|---|
| 2025 | $3,147 | $238,600 | $60,100 | $178,500 |
| 2024 | $2,987 | $217,200 | $60,100 | $157,100 |
| 2023 | $2,879 | $200,800 | $52,300 | $148,500 |
| 2022 | $2,665 | $175,200 | $41,800 | $133,400 |
| 2021 | $2,603 | $159,900 | $33,500 | $126,400 |
| 2020 | $2,457 | $144,500 | $33,200 | $111,300 |
| 2019 | $2,344 | $130,200 | $29,000 | $101,200 |
| 2018 | $2,328 | $123,100 | $29,000 | $94,100 |
| 2017 | $2,216 | $115,300 | $29,000 | $86,300 |
| 2016 | $2,246 | $109,000 | $21,900 | $87,100 |
| 2015 | $2,188 | $109,000 | $21,900 | $87,100 |
| 2014 | $2,130 | $109,000 | $21,900 | $87,100 |
Source: Public Records
Map
Nearby Homes
- 29 William St Unit 22
- 38 1/2 Bowdoin St
- 34 Elm St
- 15 Goulding St
- 22 Elm St Unit 402
- 22 Elm St Unit 110
- 22 Elm St Unit 412
- 56 Elm St Unit 2
- 14 Ashland St Unit 2R
- 60 Fruit St
- 13 West St
- 3 Marston Way
- 13 Hampden St
- 21 Fruit St
- 10 Congress St Unit 7
- 17 Federal St Unit 210
- 531 Main St Unit 410
- 531 Main St Unit 403
- 80 Salisbury St Unit 206
- 6 Pelham St
Your Personal Tour Guide
Ask me questions while you tour the home.