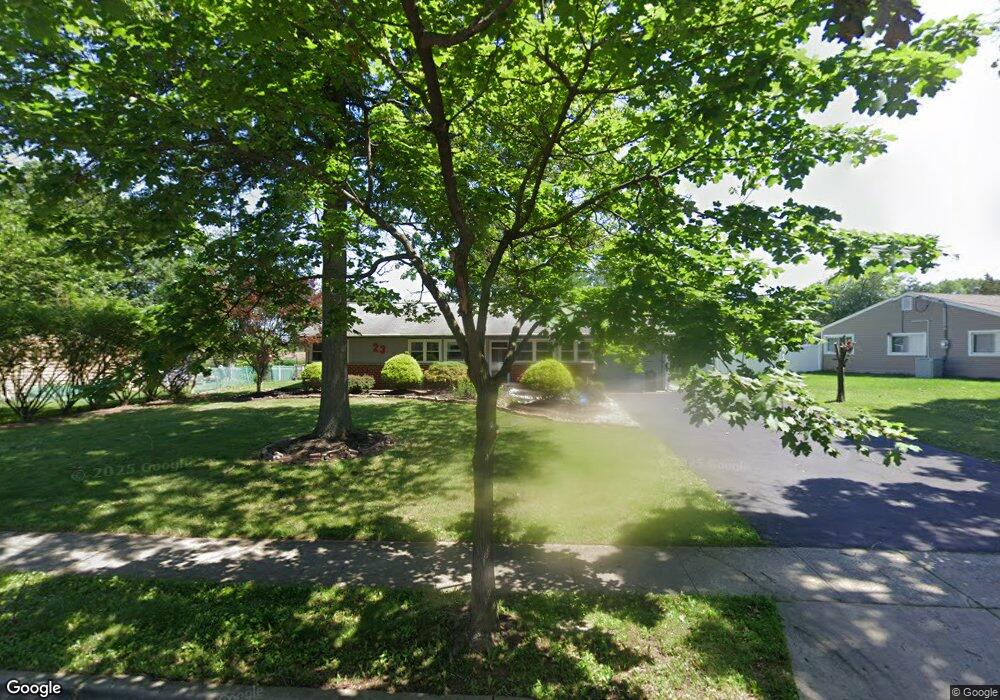
23 Joline Rd Kendall Park, NJ 08824
Estimated Value: $506,000 - $557,000
3
Beds
2
Baths
1,508
Sq Ft
$354/Sq Ft
Est. Value
About This Home
This home is located at 23 Joline Rd, Kendall Park, NJ 08824 and is currently estimated at $533,780, approximately $353 per square foot. 23 Joline Rd is a home located in Middlesex County with nearby schools including Cambridge Elementary School, Crossroads South Middle School, and South Brunswick High School.
Ownership History
Date
Name
Owned For
Owner Type
Purchase Details
Closed on
Oct 25, 2018
Sold by
Wang Tsao George Wen Tsung and Wang Tsao Jessica Chuen
Bought by
Cui Xiuhua
Current Estimated Value
Purchase Details
Closed on
Mar 29, 2010
Sold by
Feiler Bryan
Bought by
Tsao Wen Tsung and Wang Chuen
Home Financials for this Owner
Home Financials are based on the most recent Mortgage that was taken out on this home.
Original Mortgage
$266,800
Interest Rate
5.12%
Mortgage Type
New Conventional
Create a Home Valuation Report for This Property
The Home Valuation Report is an in-depth analysis detailing your home's value as well as a comparison with similar homes in the area
Home Values in the Area
Average Home Value in this Area
Purchase History
| Date | Buyer | Sale Price | Title Company |
|---|---|---|---|
| Cui Xiuhua | $340,000 | None Available | |
| Tsao Wen Tsung | $333,500 | Fidelity Natl Title Ins Co |
Source: Public Records
Mortgage History
| Date | Status | Borrower | Loan Amount |
|---|---|---|---|
| Previous Owner | Tsao Wen Tsung | $266,800 |
Source: Public Records
Tax History Compared to Growth
Tax History
| Year | Tax Paid | Tax Assessment Tax Assessment Total Assessment is a certain percentage of the fair market value that is determined by local assessors to be the total taxable value of land and additions on the property. | Land | Improvement |
|---|---|---|---|---|
| 2025 | $7,946 | $146,500 | $75,400 | $71,100 |
| 2024 | $7,502 | $145,900 | $75,400 | $70,500 |
| 2023 | $7,502 | $142,900 | $75,400 | $67,500 |
| 2022 | $7,282 | $142,900 | $75,400 | $67,500 |
| 2021 | $5,596 | $142,900 | $75,400 | $67,500 |
| 2020 | $7,322 | $142,900 | $75,400 | $67,500 |
| 2019 | $7,387 | $142,900 | $75,400 | $67,500 |
| 2018 | $7,145 | $142,900 | $75,400 | $67,500 |
| 2017 | $7,134 | $142,900 | $75,400 | $67,500 |
| 2016 | $7,058 | $142,900 | $75,400 | $67,500 |
| 2015 | $6,843 | $142,900 | $75,400 | $67,500 |
| 2014 | $6,733 | $142,900 | $75,400 | $67,500 |
Source: Public Records
Map
Nearby Homes