23 King Arthur Ct Unit 2312 Northlake, IL 60164
Estimated Value: $100,000 - $127,046
1
Bed
--
Bath
779
Sq Ft
$150/Sq Ft
Est. Value
About This Home
This home is located at 23 King Arthur Ct Unit 2312, Northlake, IL 60164 and is currently estimated at $116,512, approximately $149 per square foot. 23 King Arthur Ct Unit 2312 is a home located in Cook County with nearby schools including Roy Elementary School, Mannheim Middle School, and West Leyden High School.
Ownership History
Date
Name
Owned For
Owner Type
Purchase Details
Closed on
Apr 8, 2019
Sold by
Careaga Juan H
Bought by
Juan H Careaga Revocable Trust
Current Estimated Value
Purchase Details
Closed on
Jul 27, 2016
Sold by
Escobar Jesus M and Demonroy Patricia Carvajal
Bought by
Careaga Juan H
Purchase Details
Closed on
Feb 3, 2015
Sold by
Escobar Jesus M and Martinez Beatriz
Bought by
Carvajal Escobar Jesus D and Carvajal De Monroy Patricia
Purchase Details
Closed on
Jul 27, 2013
Sold by
Federal Home Loan Mortgage Corporation
Bought by
Escobar Jesus M and Martinez Beatriz E
Purchase Details
Closed on
Sep 5, 2012
Sold by
Rosa Juan De La
Bought by
Federal Home Loan Mortgage Corporation
Purchase Details
Closed on
Jul 12, 1996
Sold by
Firstar Bank Illinois
Bought by
Delarosa Juan
Home Financials for this Owner
Home Financials are based on the most recent Mortgage that was taken out on this home.
Original Mortgage
$32,300
Interest Rate
8.43%
Create a Home Valuation Report for This Property
The Home Valuation Report is an in-depth analysis detailing your home's value as well as a comparison with similar homes in the area
Home Values in the Area
Average Home Value in this Area
Purchase History
| Date | Buyer | Sale Price | Title Company |
|---|---|---|---|
| Juan H Careaga Revocable Trust | -- | Accommodation | |
| Careaga Juan H | $56,500 | None Available | |
| Carvajal Escobar Jesus D | -- | None Available | |
| Escobar Jesus M | $21,000 | Attorneys Title Guaranty Fun | |
| Federal Home Loan Mortgage Corporation | -- | None Available | |
| Delarosa Juan | $36,000 | -- |
Source: Public Records
Mortgage History
| Date | Status | Borrower | Loan Amount |
|---|---|---|---|
| Previous Owner | Delarosa Juan | $32,300 |
Source: Public Records
Tax History Compared to Growth
Tax History
| Year | Tax Paid | Tax Assessment Tax Assessment Total Assessment is a certain percentage of the fair market value that is determined by local assessors to be the total taxable value of land and additions on the property. | Land | Improvement |
|---|---|---|---|---|
| 2024 | $1,252 | $7,012 | $684 | $6,328 |
| 2023 | $1,214 | $7,012 | $684 | $6,328 |
| 2022 | $1,214 | $7,012 | $684 | $6,328 |
| 2021 | $453 | $4,453 | $658 | $3,795 |
| 2020 | $535 | $4,453 | $658 | $3,795 |
| 2019 | $611 | $5,078 | $658 | $4,420 |
| 2018 | $0 | $3,330 | $557 | $2,773 |
| 2017 | $0 | $3,330 | $557 | $2,773 |
| 2016 | $324 | $3,330 | $557 | $2,773 |
| 2015 | $744 | $4,420 | $506 | $3,914 |
| 2014 | $751 | $4,420 | $506 | $3,914 |
| 2013 | $692 | $4,420 | $506 | $3,914 |
Source: Public Records
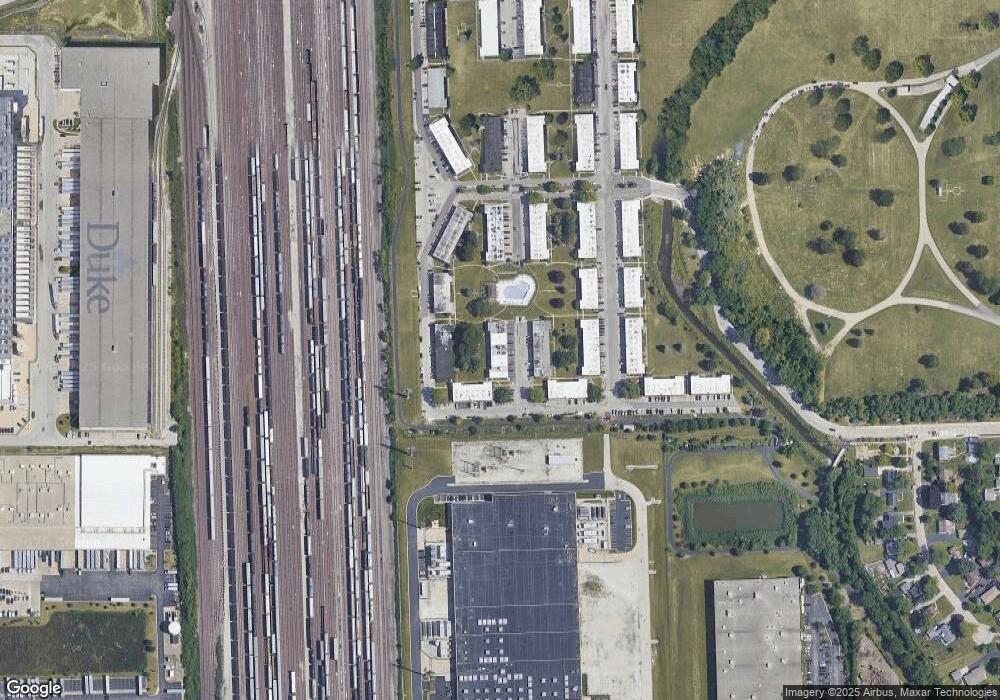
Map
Nearby Homes
- 23 King Arthur Ct Unit 6
- 26 King Arthur Ct Unit 4
- 16 King Arthur Ct Unit 16
- 38 King Arthur Ct Unit 14
- 41 King Arthur Ct Unit 1
- 35 King Arthur Ct Unit 19
- 44 King Arthur Ct Unit 7
- 11353 W Grand Ave
- 738 N Parker St
- 728 N Parker St
- 335 N Wolf Rd
- 3112 Pearl Ave
- 337 E Fullerton Ave
- 10 Belle Dr
- 115 N Lavergne Ave
- 780 N Adele St
- 140 Armitage Ave
- 281 E North End Ave
- 250 Village Dr
- 77 N Wolf Rd Unit 312
- 23 King Arthur Ct Unit 7
- 23 King Arthur Ct Unit 2319
- 23 King Arthur Ct Unit 232
- 23 King Arthur Ct Unit 2318
- 23 King Arthur Ct Unit 231
- 23 King Arthur Ct Unit 235
- 23 King Arthur Ct Unit 236
- 23 King Arthur Ct Unit 239
- 23 King Arthur Ct Unit 238
- 23 King Arthur Ct Unit 2311
- 23 King Arthur Ct Unit 2320
- 23 King Arthur Ct Unit 233
- 23 King Arthur Ct Unit 2310
- 23 King Arthur Ct Unit 234
- 23 King Arthur Ct Unit 237
- 23 King Arthur Ct Unit 2317
- 23 King Arthur Ct Unit 2316
- 23 King Arthur Ct Unit 2315
- 23 King Arthur Ct Unit 2314