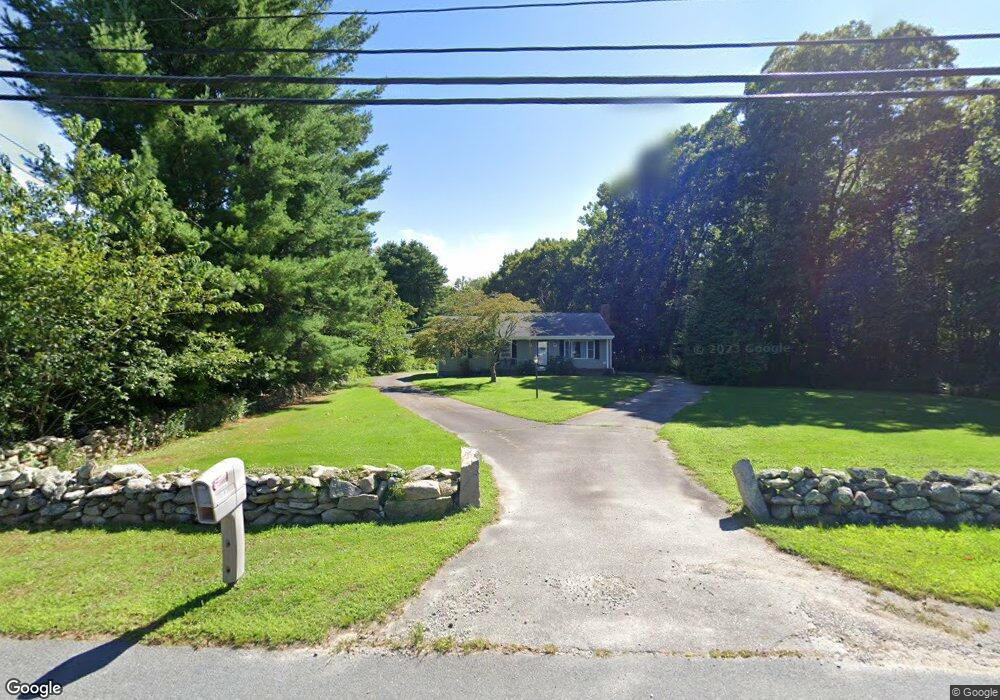
23 Kirby Rd Westport, MA 02790
Booth/Handy Four Corners NeighborhoodEstimated Value: $487,000 - $600,000
2
Beds
--
Bath
1,056
Sq Ft
$497/Sq Ft
Est. Value
About This Home
This home is located at 23 Kirby Rd, Westport, MA 02790 and is currently estimated at $525,046, approximately $497 per square foot. 23 Kirby Rd is a home located in Bristol County with nearby schools including Alice A. Macomber Primary School, Westport Elementary School, and Westport Middle-High School.
Ownership History
Date
Name
Owned For
Owner Type
Purchase Details
Closed on
Aug 30, 2021
Sold by
Beaulieu Brian A
Bought by
Farias Stacey L and Farias Matthew T
Current Estimated Value
Home Financials for this Owner
Home Financials are based on the most recent Mortgage that was taken out on this home.
Original Mortgage
$362,000
Outstanding Balance
$329,393
Interest Rate
2.8%
Mortgage Type
Purchase Money Mortgage
Estimated Equity
$195,653
Purchase Details
Closed on
Jul 3, 2017
Sold by
Beaulieu Margaret A
Bought by
Beaulieu Brian A
Home Financials for this Owner
Home Financials are based on the most recent Mortgage that was taken out on this home.
Original Mortgage
$225,000
Interest Rate
4.02%
Mortgage Type
New Conventional
Create a Home Valuation Report for This Property
The Home Valuation Report is an in-depth analysis detailing your home's value as well as a comparison with similar homes in the area
Home Values in the Area
Average Home Value in this Area
Purchase History
| Date | Buyer | Sale Price | Title Company |
|---|---|---|---|
| Farias Stacey L | $385,000 | None Available | |
| Beaulieu Brian A | -- | -- |
Source: Public Records
Mortgage History
| Date | Status | Borrower | Loan Amount |
|---|---|---|---|
| Open | Farias Stacey L | $362,000 | |
| Previous Owner | Beaulieu Brian A | $225,000 |
Source: Public Records
Tax History Compared to Growth
Tax History
| Year | Tax Paid | Tax Assessment Tax Assessment Total Assessment is a certain percentage of the fair market value that is determined by local assessors to be the total taxable value of land and additions on the property. | Land | Improvement |
|---|---|---|---|---|
| 2025 | $3,200 | $429,500 | $191,200 | $238,300 |
| 2024 | $3,189 | $412,500 | $177,200 | $235,300 |
| 2023 | $2,738 | $335,500 | $149,300 | $186,200 |
| 2022 | $2,550 | $300,700 | $149,300 | $151,400 |
| 2021 | $2,475 | $287,100 | $135,700 | $151,400 |
| 2020 | $2,327 | $276,000 | $124,600 | $151,400 |
| 2019 | $2,186 | $264,300 | $113,300 | $151,000 |
| 2018 | $2,038 | $249,400 | $113,700 | $135,700 |
| 2017 | $1,938 | $243,200 | $110,000 | $133,200 |
| 2016 | $1,807 | $228,500 | $106,400 | $122,100 |
| 2015 | $1,737 | $219,000 | $108,800 | $110,200 |
Source: Public Records
Map
Nearby Homes
- 7 Village Way
- 8 Village Way
- 15 Village Way
- 837 Main Rd
- 8 Strawberry Ln
- 118 Charlotte White Rd Extension
- 0 Hidden Glen Ln
- 101 Adamsville Rd
- 920 Drift Rd
- 225 Hixbridge Rd
- 118 Charlotte White Rd
- 978 Sodom Rd
- Lot 0 Marcotte
- 47 Fallon Dr
- 73 White Oak Run
- 1346 Main Rd Unit B
- 4 Main Rd
- 6 Angel Ct
- 17 Quail Trail
- 308 Robert St