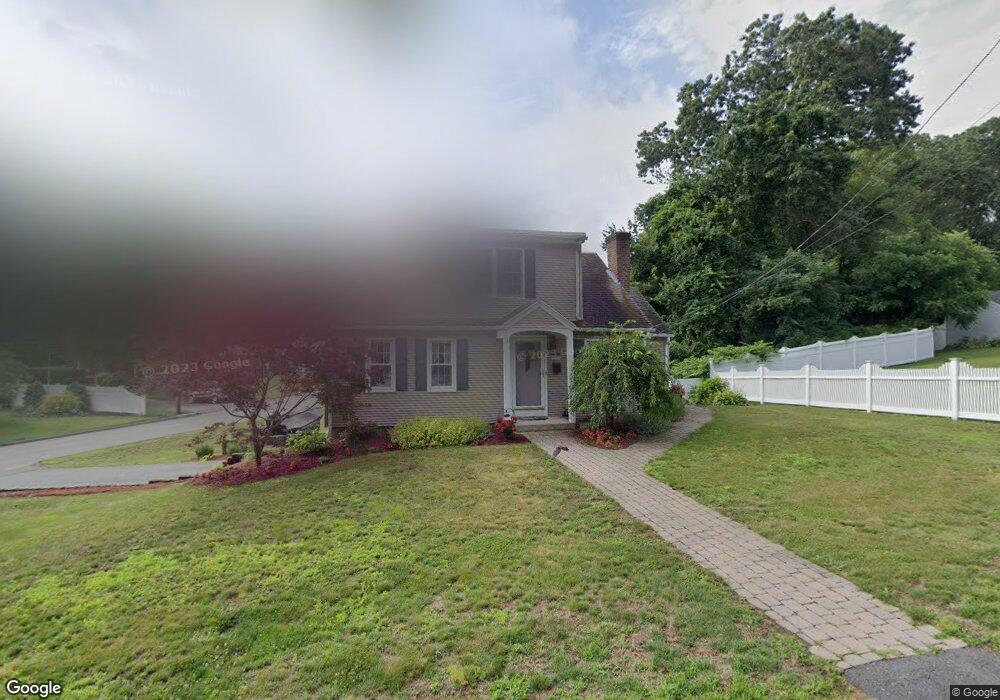
23 Knowles St Auburn, MA 01501
Downtown Auburn NeighborhoodEstimated Value: $389,000 - $518,000
3
Beds
3
Baths
1,698
Sq Ft
$276/Sq Ft
Est. Value
About This Home
This home is located at 23 Knowles St, Auburn, MA 01501 and is currently estimated at $468,668, approximately $276 per square foot. 23 Knowles St is a home located in Worcester County with nearby schools including Auburn Senior High School and Shrewsbury Montessori School - Auburn Campus.
Ownership History
Date
Name
Owned For
Owner Type
Purchase Details
Closed on
Apr 30, 1996
Sold by
Bjorkman Donald P and Bjorkman Nancy L
Bought by
Wambach Robert E and Wambach Karen
Current Estimated Value
Home Financials for this Owner
Home Financials are based on the most recent Mortgage that was taken out on this home.
Original Mortgage
$74,438
Interest Rate
7.81%
Mortgage Type
Purchase Money Mortgage
Create a Home Valuation Report for This Property
The Home Valuation Report is an in-depth analysis detailing your home's value as well as a comparison with similar homes in the area
Home Values in the Area
Average Home Value in this Area
Purchase History
| Date | Buyer | Sale Price | Title Company |
|---|---|---|---|
| Wambach Robert E | $75,000 | -- |
Source: Public Records
Mortgage History
| Date | Status | Borrower | Loan Amount |
|---|---|---|---|
| Open | Wambach Robert E | $132,000 | |
| Closed | Wambach Robert E | $131,250 | |
| Closed | Wambach Robert E | $76,000 | |
| Closed | Wambach Robert E | $74,438 |
Source: Public Records
Tax History
| Year | Tax Paid | Tax Assessment Tax Assessment Total Assessment is a certain percentage of the fair market value that is determined by local assessors to be the total taxable value of land and additions on the property. | Land | Improvement |
|---|---|---|---|---|
| 2025 | $61 | $429,800 | $138,300 | $291,500 |
| 2024 | $6,278 | $420,500 | $132,000 | $288,500 |
| 2023 | $6,180 | $389,200 | $120,000 | $269,200 |
| 2022 | $5,768 | $342,900 | $120,000 | $222,900 |
| 2021 | $74 | $300,500 | $105,900 | $194,600 |
| 2020 | $73 | $293,000 | $105,900 | $187,100 |
| 2019 | $76 | $271,300 | $104,900 | $166,400 |
| 2018 | $3,771 | $258,300 | $98,100 | $160,200 |
| 2017 | $4,570 | $249,200 | $89,000 | $160,200 |
| 2016 | $4,280 | $236,600 | $92,900 | $143,700 |
| 2015 | $3,985 | $230,900 | $92,900 | $138,000 |
| 2014 | $3,889 | $224,900 | $88,500 | $136,400 |
Source: Public Records
Map
Nearby Homes
- 8 South Terrace
- 61 School St
- 6 George St
- 751 Washington St Unit 43A
- 36 Central St
- 137 South St
- 166 Leicester St
- 634 Oxford St S
- 328 Oxford St N
- 35 Waterman Rd
- 33 Eastford Rd
- 31 Walsh Ave
- 31-33 Walsh Ave
- 33 Walsh Ave
- 40 Bryn Mawr Ave
- 49 Prospect St
- 808 Washington St
- 19-20 Williams St
- 0 Athens St
- 4 Athens St
Your Personal Tour Guide
Ask me questions while you tour the home.