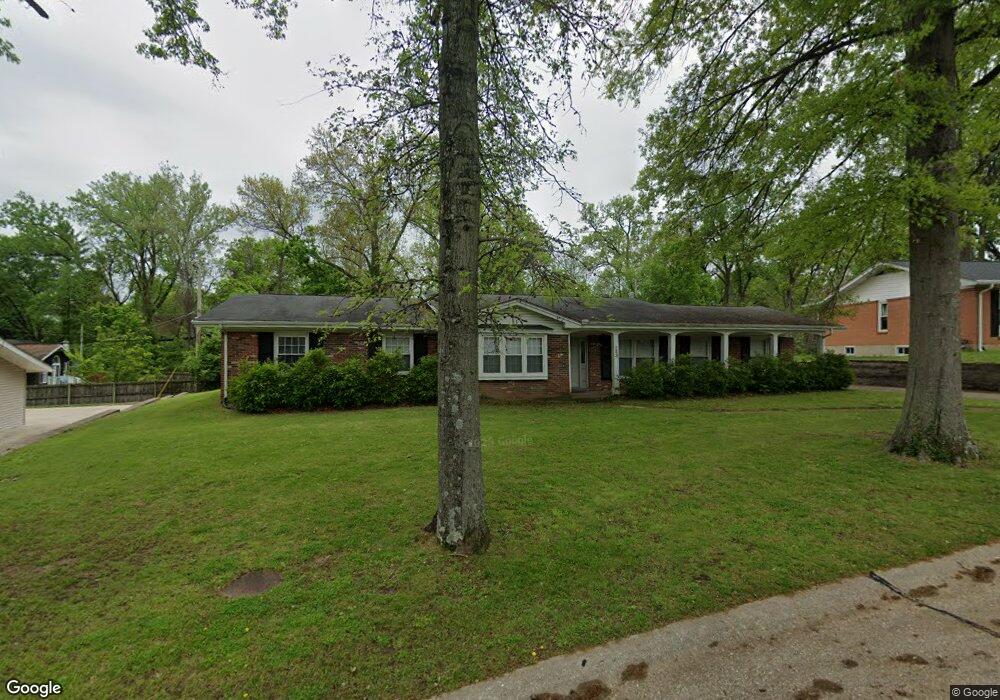
23 La Gorce Dr Chesterfield, MO 63017
Estimated Value: $385,000 - $424,000
3
Beds
2
Baths
2,022
Sq Ft
$201/Sq Ft
Est. Value
About This Home
This home is located at 23 La Gorce Dr, Chesterfield, MO 63017 and is currently estimated at $406,881, approximately $201 per square foot. 23 La Gorce Dr is a home located in St. Louis County with nearby schools including River Bend Elementary School, Parkway Central Middle School, and Parkway Central High School.
Ownership History
Date
Name
Owned For
Owner Type
Purchase Details
Closed on
May 18, 2011
Sold by
Deutsche Bank National Trust Company
Bought by
Yn Ty and Thai Yn Christie
Current Estimated Value
Purchase Details
Closed on
Aug 24, 2010
Sold by
Kersten Christopher J
Bought by
Deutsche Bank National Trust Company
Purchase Details
Closed on
Nov 2, 2009
Sold by
Kersten David J and Kersten Kimberly A
Bought by
Kersten Christopher J
Purchase Details
Closed on
Nov 28, 2007
Sold by
Kersten Christopher J
Bought by
Kersten David J and Kersten Nancy M
Purchase Details
Closed on
Nov 28, 2001
Sold by
Interland Capital Corp
Bought by
Kersten Christopher J
Home Financials for this Owner
Home Financials are based on the most recent Mortgage that was taken out on this home.
Original Mortgage
$166,567
Interest Rate
7.15%
Purchase Details
Closed on
Jul 19, 2001
Sold by
Kelly John W
Bought by
Interland Capital Corp
Home Financials for this Owner
Home Financials are based on the most recent Mortgage that was taken out on this home.
Original Mortgage
$160,000
Interest Rate
7.18%
Create a Home Valuation Report for This Property
The Home Valuation Report is an in-depth analysis detailing your home's value as well as a comparison with similar homes in the area
Home Values in the Area
Average Home Value in this Area
Purchase History
| Date | Buyer | Sale Price | Title Company |
|---|---|---|---|
| Yn Ty | $148,000 | Integrity Land Title Co Inc | |
| Deutsche Bank National Trust Company | $180,800 | None Available | |
| Kersten Christopher J | -- | None Available | |
| Kersten David J | -- | None Available | |
| Kersten Christopher J | -- | -- | |
| Interland Capital Corp | $150,000 | -- |
Source: Public Records
Mortgage History
| Date | Status | Borrower | Loan Amount |
|---|---|---|---|
| Previous Owner | Kersten Christopher J | $166,567 | |
| Previous Owner | Interland Capital Corp | $160,000 |
Source: Public Records
Tax History Compared to Growth
Tax History
| Year | Tax Paid | Tax Assessment Tax Assessment Total Assessment is a certain percentage of the fair market value that is determined by local assessors to be the total taxable value of land and additions on the property. | Land | Improvement |
|---|---|---|---|---|
| 2025 | $3,805 | $55,670 | $36,730 | $18,940 |
| 2024 | $3,805 | $57,400 | $24,420 | $32,980 |
| 2023 | $3,650 | $57,400 | $24,420 | $32,980 |
| 2022 | $3,230 | $46,190 | $24,420 | $21,770 |
| 2021 | $3,217 | $46,190 | $24,420 | $21,770 |
| 2020 | $3,100 | $42,730 | $20,940 | $21,790 |
| 2019 | $3,032 | $42,730 | $20,940 | $21,790 |
| 2018 | $3,077 | $40,220 | $19,190 | $21,030 |
| 2017 | $2,994 | $40,220 | $19,190 | $21,030 |
| 2016 | $2,921 | $37,290 | $15,690 | $21,600 |
| 2015 | $3,062 | $37,290 | $15,690 | $21,600 |
| 2014 | $3,386 | $44,140 | $9,520 | $34,620 |
Source: Public Records
Map
Nearby Homes
- 56 Forest Crest Dr
- 13449 Manorlac Dr Unit 9D
- 13489 Beaulac Dr
- 857 Coalport Dr
- 13417 Forestlac Dr
- 922 Pavillion Dr
- 13314 Wood Chapel Dr
- 13573 Coliseum Dr
- 13579 Coliseum Dr Unit G
- 13555 Coliseum Dr Unit G
- 13515 Coliseum Dr Unit E
- 13515 Coliseum Dr Unit A
- 13503 Coliseum Dr
- 14036 Agusta Dr
- 13453 Coliseum Dr Unit E
- 722 Aramis Dr
- 1125 Matador Dr
- 809 Aramis Dr
- 290 Ridge Trail Ct
- 24 Muirfield Ln
- 22 La Gorce Dr
- 719 N Woods Mill Rd
- 20 Orange Hills Dr
- 25 La Gorce Dr
- 21 La Gorce Dr
- 715 N Woods Mill Rd
- 110 Beechwood Ct
- 59 Forest Crest Dr
- 58 Forest Crest Dr
- 29 La Gorce Dr
- 57 Forest Crest Dr
- 19 Orange Hills Dr
- 111 La Gorce Dr
- 60 Forest Crest Dr
- 800 N Woods Mill Rd
- 30 Oakland Hills Dr
- 55 Forest Crest Dr
- 28 La Gorce Dr
- 18 Orange Hills Dr
- 54 Forest Crest Dr