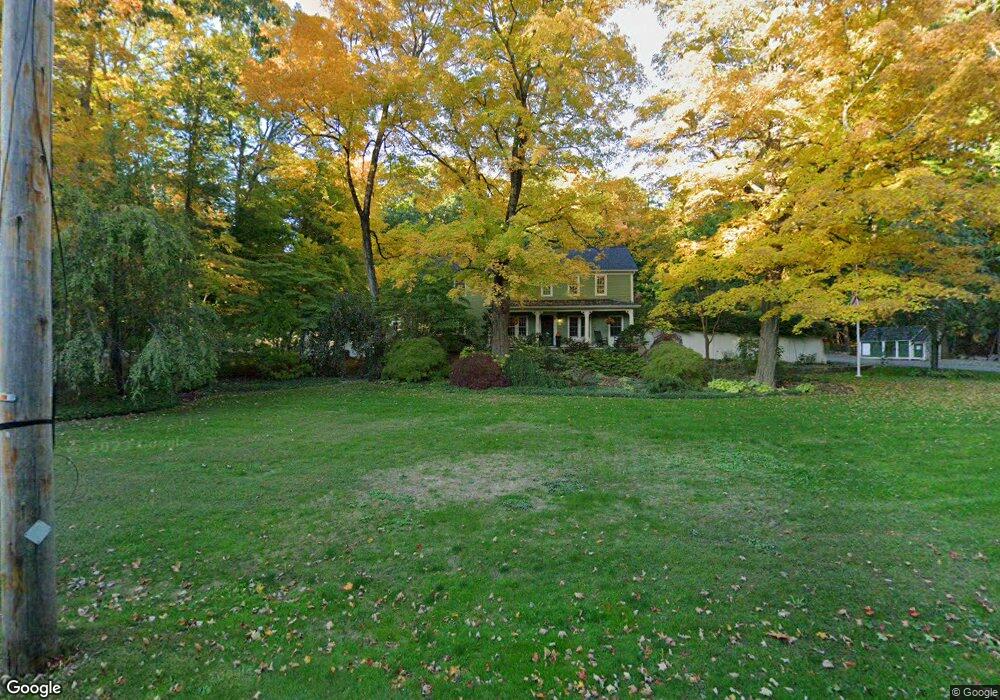
23 Lake St Sherborn, MA 01770
Estimated Value: $1,692,000 - $2,206,000
Studio
5
Baths
--
Sq Ft
43,560
Sq Ft Lot
About This Home
This home is located at 23 Lake St, Sherborn, MA 01770 and is currently estimated at $1,907,220. 23 Lake St is a home located in Middlesex County with nearby schools including Pine Hill Elementary School, Dover-Sherborn Regional Middle School, and Dover-Sherborn Regional High School.
Ownership History
Date
Name
Owned For
Owner Type
Purchase Details
Closed on
Apr 4, 2012
Sold by
Clifton-Hailer Lisa A and Hailer John T
Bought by
Clifton Lisa A
Current Estimated Value
Purchase Details
Closed on
Oct 30, 1992
Sold by
Gilligan Maryann
Bought by
Hailer John T and Hailer Lisa C
Purchase Details
Closed on
Mar 30, 1990
Sold by
Hougen Thomas J
Bought by
Rose Harry K
Create a Home Valuation Report for This Property
The Home Valuation Report is an in-depth analysis detailing your home's value as well as a comparison with similar homes in the area
Home Values in the Area
Average Home Value in this Area
Purchase History
| Date | Buyer | Sale Price | Title Company |
|---|---|---|---|
| Clifton Lisa A | -- | -- | |
| Clifton Lisa A | -- | -- | |
| Hailer John T | $335,000 | -- | |
| Hailer John T | $335,000 | -- | |
| Rose Harry K | $320,000 | -- | |
| Rose Harry K | $320,000 | -- |
Source: Public Records
Mortgage History
| Date | Status | Borrower | Loan Amount |
|---|---|---|---|
| Previous Owner | Rose Harry K | $700,000 | |
| Previous Owner | Rose Harry K | $302,000 |
Source: Public Records
Tax History
| Year | Tax Paid | Tax Assessment Tax Assessment Total Assessment is a certain percentage of the fair market value that is determined by local assessors to be the total taxable value of land and additions on the property. | Land | Improvement |
|---|---|---|---|---|
| 2025 | $28,055 | $1,692,100 | $358,100 | $1,334,000 |
| 2024 | $55,226 | $1,629,100 | $300,600 | $1,328,500 |
| 2023 | $26,837 | $1,490,100 | $300,600 | $1,189,500 |
| 2022 | $24,461 | $1,285,400 | $300,600 | $984,800 |
| 2021 | $4,939 | $1,285,400 | $300,600 | $984,800 |
| 2020 | $24,033 | $1,235,000 | $300,600 | $934,400 |
| 2019 | $23,240 | $1,184,500 | $300,600 | $883,900 |
| 2018 | $22,861 | $1,184,500 | $300,600 | $883,900 |
| 2017 | $21,819 | $1,066,400 | $285,500 | $780,900 |
| 2016 | $21,936 | $1,066,400 | $285,500 | $780,900 |
| 2015 | $21,645 | $1,065,200 | $277,500 | $787,700 |
| 2014 | $21,715 | $1,067,600 | $260,500 | $807,100 |
Source: Public Records
Map
Nearby Homes
- 124 Everett St
- 13 Morgan Dr Unit 109
- 17 Morgan Dr Unit 204
- 8 Washington St
- 6 Hopewell Farm Rd
- 7 Allison Way Unit 7
- 7 Morgan Dr Unit 203
- 11 Wyndemere Ln
- 17 Wyndemere Ln
- 137 Lake St
- 5 Farm Rd
- 63 Farm Road Lot 5
- 303 Eliot St
- 30 Sienna Ln Unit 30
- 1 Fern St
- 14 Sewall Brook Ln
- 8 Hudson St
- 41 Ivy Ln
- 216-218 S Main St
- 90 Maple St
Your Personal Tour Guide
Ask me questions while you tour the home.