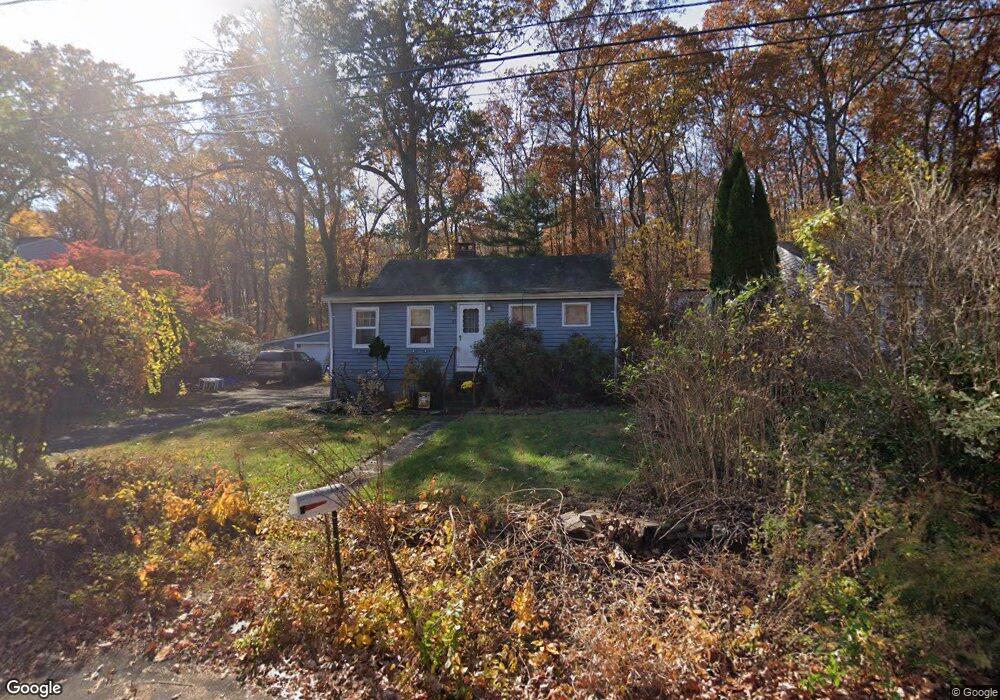
23 Lakewood Rd East Hampton, CT 06424
Estimated Value: $187,000 - $284,536
2
Beds
1
Bath
1,216
Sq Ft
$202/Sq Ft
Est. Value
About This Home
This home is located at 23 Lakewood Rd, East Hampton, CT 06424 and is currently estimated at $245,884, approximately $202 per square foot. 23 Lakewood Rd is a home located in Middlesex County with nearby schools including Memorial School, Center Elementary School, and East Hampton Middle School.
Ownership History
Date
Name
Owned For
Owner Type
Purchase Details
Closed on
Dec 23, 2020
Sold by
Strong Elizabeth K
Bought by
Strong Timothy A
Current Estimated Value
Home Financials for this Owner
Home Financials are based on the most recent Mortgage that was taken out on this home.
Original Mortgage
$90,000
Outstanding Balance
$80,270
Interest Rate
2.8%
Mortgage Type
New Conventional
Estimated Equity
$165,614
Purchase Details
Closed on
Nov 9, 1961
Bought by
Strong Elizabeth K
Create a Home Valuation Report for This Property
The Home Valuation Report is an in-depth analysis detailing your home's value as well as a comparison with similar homes in the area
Home Values in the Area
Average Home Value in this Area
Purchase History
| Date | Buyer | Sale Price | Title Company |
|---|---|---|---|
| Strong Timothy A | $100,000 | None Available | |
| Strong Timothy A | $100,000 | None Available | |
| Strong Elizabeth K | -- | -- |
Source: Public Records
Mortgage History
| Date | Status | Borrower | Loan Amount |
|---|---|---|---|
| Open | Strong Timothy A | $90,000 | |
| Closed | Strong Timothy A | $90,000 |
Source: Public Records
Tax History Compared to Growth
Tax History
| Year | Tax Paid | Tax Assessment Tax Assessment Total Assessment is a certain percentage of the fair market value that is determined by local assessors to be the total taxable value of land and additions on the property. | Land | Improvement |
|---|---|---|---|---|
| 2025 | $4,805 | $121,000 | $52,600 | $68,400 |
| 2024 | $4,603 | $121,000 | $52,600 | $68,400 |
| 2023 | $4,363 | $121,000 | $52,600 | $68,400 |
| 2022 | $4,194 | $121,000 | $52,600 | $68,400 |
| 2021 | $4,178 | $121,000 | $52,600 | $68,400 |
| 2020 | $3,395 | $102,440 | $36,230 | $66,210 |
| 2019 | $3,390 | $102,300 | $40,910 | $61,390 |
| 2018 | $3,204 | $102,300 | $40,910 | $61,390 |
| 2017 | $3,204 | $102,300 | $40,910 | $61,390 |
| 2016 | $3,012 | $102,300 | $40,910 | $61,390 |
| 2015 | $3,344 | $120,360 | $48,130 | $72,230 |
| 2014 | $2,909 | $120,360 | $48,130 | $72,230 |
Source: Public Records
Map
Nearby Homes