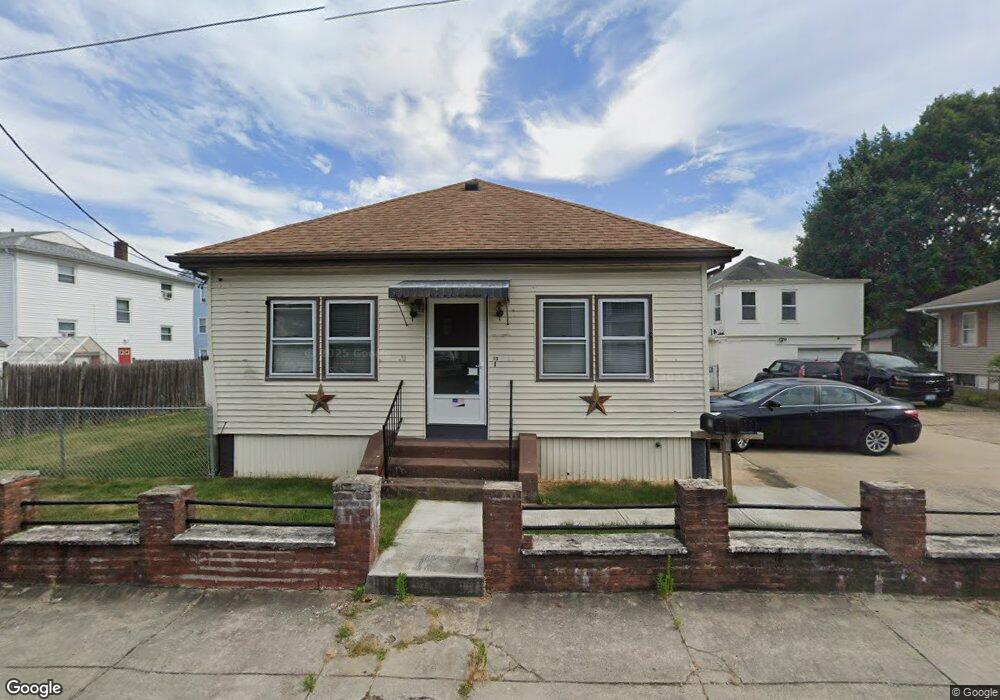
23 Lawton St Pawtucket, RI 02860
Quality Hill NeighborhoodEstimated Value: $249,096 - $381,000
1
Bed
1
Bath
690
Sq Ft
$456/Sq Ft
Est. Value
About This Home
This home is located at 23 Lawton St, Pawtucket, RI 02860 and is currently estimated at $314,774, approximately $456 per square foot. 23 Lawton St is a home located in Providence County with nearby schools including International Charter School and Saint Raphael Academy.
Ownership History
Date
Name
Owned For
Owner Type
Purchase Details
Closed on
Jan 8, 2009
Sold by
Deutsche Bank Natl T C
Bought by
Gagan David
Current Estimated Value
Home Financials for this Owner
Home Financials are based on the most recent Mortgage that was taken out on this home.
Original Mortgage
$135,042
Outstanding Balance
$88,250
Interest Rate
5.99%
Mortgage Type
Purchase Money Mortgage
Estimated Equity
$226,524
Purchase Details
Closed on
Mar 31, 2008
Sold by
Dias Jose C
Bought by
Deutsche Bank Natl T C
Purchase Details
Closed on
Dec 23, 2004
Sold by
Dziedzic David J and Dziedzic Maureen A
Bought by
Dias Jose C and Dias Maria F
Home Financials for this Owner
Home Financials are based on the most recent Mortgage that was taken out on this home.
Original Mortgage
$211,500
Interest Rate
5.74%
Mortgage Type
Purchase Money Mortgage
Create a Home Valuation Report for This Property
The Home Valuation Report is an in-depth analysis detailing your home's value as well as a comparison with similar homes in the area
Home Values in the Area
Average Home Value in this Area
Purchase History
| Date | Buyer | Sale Price | Title Company |
|---|---|---|---|
| Gagan David | $115,000 | -- | |
| Deutsche Bank Natl T C | $191,250 | -- | |
| Dias Jose C | $235,000 | -- |
Source: Public Records
Mortgage History
| Date | Status | Borrower | Loan Amount |
|---|---|---|---|
| Open | Dias Jose C | $135,042 | |
| Previous Owner | Dias Jose C | $211,500 |
Source: Public Records
Tax History Compared to Growth
Tax History
| Year | Tax Paid | Tax Assessment Tax Assessment Total Assessment is a certain percentage of the fair market value that is determined by local assessors to be the total taxable value of land and additions on the property. | Land | Improvement |
|---|---|---|---|---|
| 2025 | $1,823 | $138,600 | $101,100 | $37,500 |
| 2024 | $1,710 | $138,600 | $101,100 | $37,500 |
| 2023 | $1,509 | $89,100 | $58,600 | $30,500 |
| 2022 | $2,936 | $89,100 | $58,600 | $30,500 |
| 2021 | $2,936 | $89,100 | $58,600 | $30,500 |
| 2020 | $2,732 | $79,300 | $48,800 | $30,500 |
| 2019 | $1,657 | $79,300 | $48,800 | $30,500 |
| 2018 | $2,633 | $79,300 | $48,800 | $30,500 |
| 2017 | $2,438 | $63,100 | $38,800 | $24,300 |
| 2016 | $1,381 | $63,100 | $38,800 | $24,300 |
| 2015 | $1,381 | $63,100 | $38,800 | $24,300 |
| 2014 | $1,455 | $63,100 | $38,800 | $24,300 |
Source: Public Records
Map
Nearby Homes