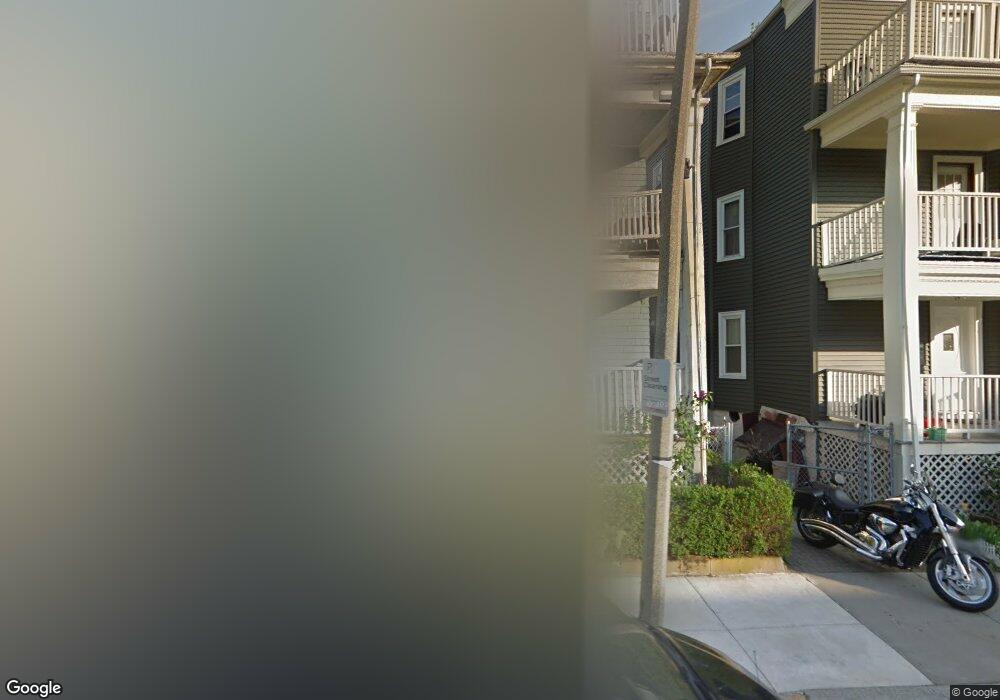
23 Lithgow St Dorchester Center, MA 02124
Saint Marks NeighborhoodEstimated Value: $1,120,000 - $1,413,000
9
Beds
6
Baths
3,840
Sq Ft
$336/Sq Ft
Est. Value
About This Home
This home is located at 23 Lithgow St, Dorchester Center, MA 02124 and is currently estimated at $1,288,333, approximately $335 per square foot. 23 Lithgow St is a home located in Suffolk County with nearby schools including Codman Academy Charter Public School.
Ownership History
Date
Name
Owned For
Owner Type
Purchase Details
Closed on
Jan 20, 2005
Sold by
Jones Edwin A
Bought by
Jones Edwin A and Carter-Jones Ethel
Current Estimated Value
Home Financials for this Owner
Home Financials are based on the most recent Mortgage that was taken out on this home.
Original Mortgage
$288,000
Outstanding Balance
$145,022
Interest Rate
5.71%
Mortgage Type
Purchase Money Mortgage
Estimated Equity
$1,143,311
Create a Home Valuation Report for This Property
The Home Valuation Report is an in-depth analysis detailing your home's value as well as a comparison with similar homes in the area
Home Values in the Area
Average Home Value in this Area
Purchase History
| Date | Buyer | Sale Price | Title Company |
|---|---|---|---|
| Jones Edwin A | -- | -- |
Source: Public Records
Mortgage History
| Date | Status | Borrower | Loan Amount |
|---|---|---|---|
| Open | Jones Edwin A | $288,000 |
Source: Public Records
Tax History Compared to Growth
Tax History
| Year | Tax Paid | Tax Assessment Tax Assessment Total Assessment is a certain percentage of the fair market value that is determined by local assessors to be the total taxable value of land and additions on the property. | Land | Improvement |
|---|---|---|---|---|
| 2025 | $7,270 | $627,800 | $112,600 | $515,200 |
| 2024 | $6,031 | $553,300 | $126,300 | $427,000 |
| 2023 | $10,779 | $1,003,600 | $229,100 | $774,500 |
| 2022 | $10,398 | $955,700 | $218,100 | $737,600 |
| 2021 | $9,620 | $901,600 | $205,800 | $695,800 |
| 2020 | $7,845 | $742,900 | $213,600 | $529,300 |
| 2019 | $6,042 | $573,249 | $140,798 | $432,451 |
| 2018 | $5,561 | $530,618 | $140,798 | $389,820 |
| 2017 | $5,305 | $500,900 | $150,100 | $350,800 |
| 2016 | $5,055 | $459,500 | $150,100 | $309,400 |
| 2015 | $4,277 | $353,200 | $101,000 | $252,200 |
| 2014 | $3,925 | $312,000 | $101,000 | $211,000 |
Source: Public Records
Map
Nearby Homes
- 438 Talbot Ave
- 52 Withington St Unit 7
- 26 Harley St Unit 1
- 43 Withington St Unit 7
- 123-125 Centre St Unit TH 6
- 123-125 Centre St Unit TH4
- 29 Torrey St
- 131 Centre St
- 39 Torrey St Unit 1
- 61 Lyndhurst St Unit A
- 47 Roslin St Unit 1
- 31 Chipman St
- 39 Chipman St
- 23 Dunlap St
- 18 Santuit St
- 146 Spencer St
- 23 Roseland St
- 57 Mather St
- 19 Elmhurst St
- 28 Melville Ave
- 19 Lithgow St
- 27 Lithgow St
- 15 Lithgow St
- 15 Lithgow St Unit 3
- 24 Brent St Unit 26
- 28 Brent St
- 20 Brent St
- 20 Brent St Unit 2
- 20 Brent St Unit 1
- 20 Brent St Unit 3
- 11 Lithgow St
- 33 Lithgow St
- 33 Lithgow St Unit 2
- 18 Brent St
- 18 Brent St Unit 2
- 18 Brent St Unit 1
- 32 Brent St
- 32 Brent St Unit 2
- 32 Brent St Unit 1
- ---------- Confidential