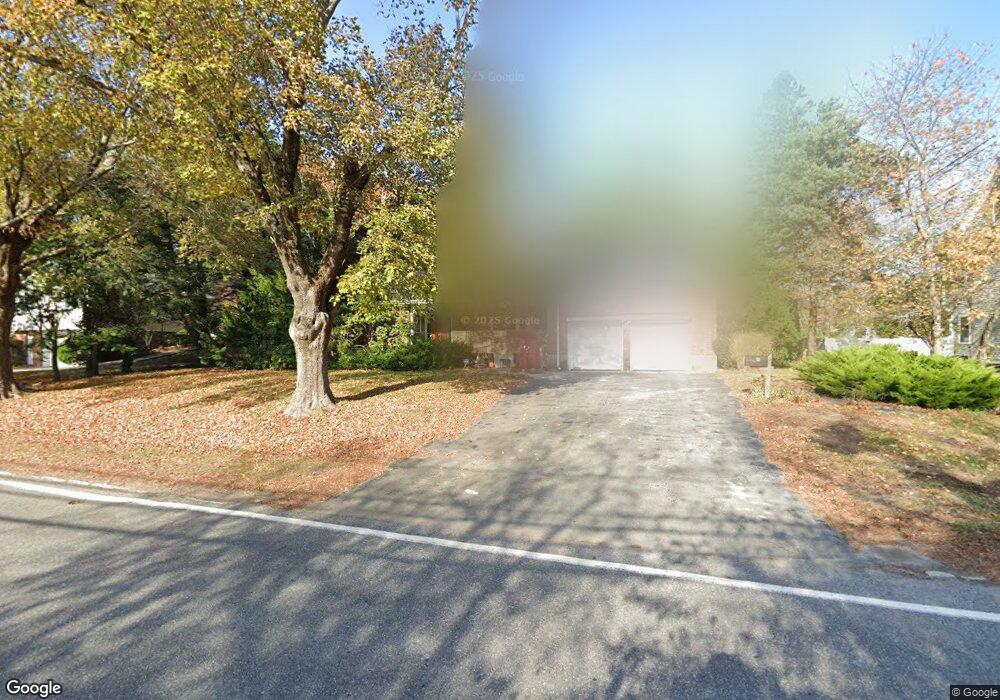
23 Lockeland Rd Winchester, MA 01890
West Side NeighborhoodEstimated Value: $1,431,245 - $1,572,000
3
Beds
3
Baths
3,623
Sq Ft
$409/Sq Ft
Est. Value
About This Home
This home is located at 23 Lockeland Rd, Winchester, MA 01890 and is currently estimated at $1,481,811, approximately $409 per square foot. 23 Lockeland Rd is a home located in Middlesex County with nearby schools including Vinson-Owen Elementary School, McCall Middle School, and Winchester High School.
Ownership History
Date
Name
Owned For
Owner Type
Purchase Details
Closed on
Mar 5, 2013
Sold by
Cannava Lucille M
Bought by
Lavigne Jane B
Current Estimated Value
Home Financials for this Owner
Home Financials are based on the most recent Mortgage that was taken out on this home.
Original Mortgage
$175,000
Outstanding Balance
$122,876
Interest Rate
3.43%
Mortgage Type
New Conventional
Estimated Equity
$1,358,935
Create a Home Valuation Report for This Property
The Home Valuation Report is an in-depth analysis detailing your home's value as well as a comparison with similar homes in the area
Home Values in the Area
Average Home Value in this Area
Purchase History
| Date | Buyer | Sale Price | Title Company |
|---|---|---|---|
| Lavigne Jane B | $285,000 | -- | |
| Lavigne Jane B | $285,000 | -- |
Source: Public Records
Mortgage History
| Date | Status | Borrower | Loan Amount |
|---|---|---|---|
| Open | Lavigne Jane B | $175,000 | |
| Closed | Lavigne Jane B | $175,000 |
Source: Public Records
Tax History Compared to Growth
Tax History
| Year | Tax Paid | Tax Assessment Tax Assessment Total Assessment is a certain percentage of the fair market value that is determined by local assessors to be the total taxable value of land and additions on the property. | Land | Improvement |
|---|---|---|---|---|
| 2025 | $137 | $1,230,900 | $871,100 | $359,800 |
| 2024 | $13,917 | $1,228,300 | $871,100 | $357,200 |
| 2023 | $12,736 | $1,079,300 | $752,400 | $326,900 |
| 2022 | $12,705 | $1,015,600 | $673,200 | $342,400 |
| 2021 | $13,317 | $896,800 | $554,400 | $342,400 |
| 2020 | $11,111 | $896,800 | $554,400 | $342,400 |
| 2019 | $10,841 | $843,300 | $500,900 | $342,400 |
| 2018 | $5,941 | $826,500 | $492,000 | $334,500 |
| 2017 | $10,149 | $826,500 | $492,000 | $334,500 |
| 2016 | $9,096 | $778,800 | $468,200 | $310,600 |
| 2015 | $8,939 | $736,300 | $425,700 | $310,600 |
| 2014 | $9,076 | $716,900 | $425,700 | $291,200 |
Source: Public Records
Map
Nearby Homes