23 Locust Ave Bridgeport, OH 43912
Estimated Value: $102,346 - $194,000
3
Beds
2
Baths
1,344
Sq Ft
$106/Sq Ft
Est. Value
About This Home
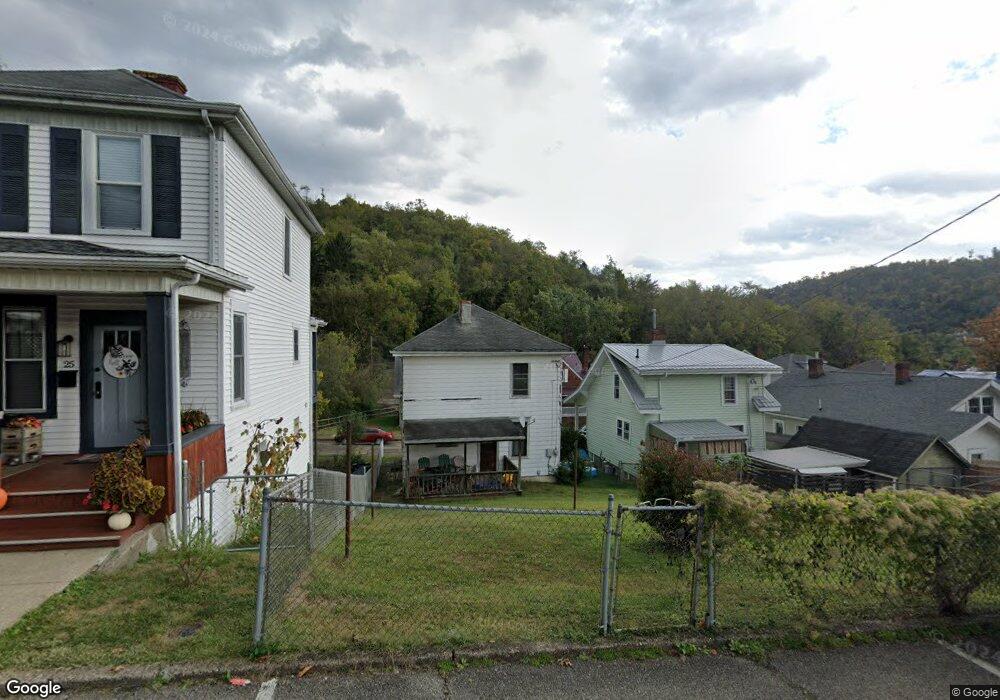
This home is located at 23 Locust Ave, Bridgeport, OH 43912 and is currently estimated at $142,337, approximately $105 per square foot. 23 Locust Ave is a home located in Belmont County with nearby schools including Bridgeport Elementary School, Bridgeport Middle School, and Bridgeport High School.
Ownership History
Date
Name
Owned For
Owner Type
Purchase Details
Closed on
Oct 23, 2009
Sold by
Bresock Karen J
Bought by
Hadzima Michelle L
Current Estimated Value
Home Financials for this Owner
Home Financials are based on the most recent Mortgage that was taken out on this home.
Original Mortgage
$42,221
Outstanding Balance
$21,126
Interest Rate
5.11%
Mortgage Type
FHA
Estimated Equity
$121,211
Purchase Details
Closed on
Aug 11, 2003
Sold by
Bresock Karen J
Bought by
Bresock Karen J
Purchase Details
Closed on
Jun 18, 2001
Sold by
Bresock Sara J and Bresock Karen J
Bought by
Bresock Sara J and Bresock Karen J
Purchase Details
Closed on
Jan 1, 1986
Sold by
Bresock Sally J
Bought by
Bresock Sally J
Create a Home Valuation Report for This Property
The Home Valuation Report is an in-depth analysis detailing your home's value as well as a comparison with similar homes in the area
Purchase History
| Date | Buyer | Sale Price | Title Company |
|---|---|---|---|
| Hadzima Michelle L | $43,000 | Attorney | |
| Bresock Karen J | -- | -- | |
| Bresock Sara J | -- | -- | |
| Bresock Sally J | -- | -- |
Source: Public Records
Mortgage History
| Date | Status | Borrower | Loan Amount |
|---|---|---|---|
| Open | Hadzima Michelle L | $42,221 |
Source: Public Records
Tax History
| Year | Tax Paid | Tax Assessment Tax Assessment Total Assessment is a certain percentage of the fair market value that is determined by local assessors to be the total taxable value of land and additions on the property. | Land | Improvement |
|---|---|---|---|---|
| 2025 | $1,057 | $27,420 | $2,640 | $24,780 |
| 2023 | $1,342 | $21,590 | $2,640 | $18,950 |
| 2022 | $1,207 | $21,585 | $2,639 | $18,946 |
| 2021 | $2,152 | $21,585 | $2,639 | $18,946 |
| 2020 | $1,453 | $18,770 | $2,300 | $16,470 |
| 2019 | $1,706 | $18,770 | $2,300 | $16,470 |
| 2018 | $1,725 | $18,770 | $2,300 | $16,470 |
| 2017 | $775 | $14,750 | $2,590 | $12,160 |
| 2016 | $872 | $14,750 | $2,590 | $12,160 |
| 2015 | $680 | $14,750 | $2,590 | $12,160 |
| 2014 | $936 | $14,900 | $2,360 | $12,540 |
| 2013 | $669 | $14,900 | $2,360 | $12,540 |
Source: Public Records
Map
Nearby Homes
- 4 Walnut Ave
- 13 Prospect St
- 26 Elm St
- 836 Main St
- 56316 National Rd
- 44 Mann St
- 806 Howard St
- 822 W Bennett St
- 56065 National Rd
- 67457 Kirkwood Heights Rd
- 67478 Kirkwood Heights Rd
- 67471 Kirkwood Heights Rd
- 422 Whitely St
- 55935 Main St
- 413 Bennett St
- 69142 Woods Rd
- 67540 Kirkwood Heights Rd
- 67531 Kirkwood Heights Rd
- 244 Lombardy Heights
- 308 Whitely St
Your Personal Tour Guide
Ask me questions while you tour the home.