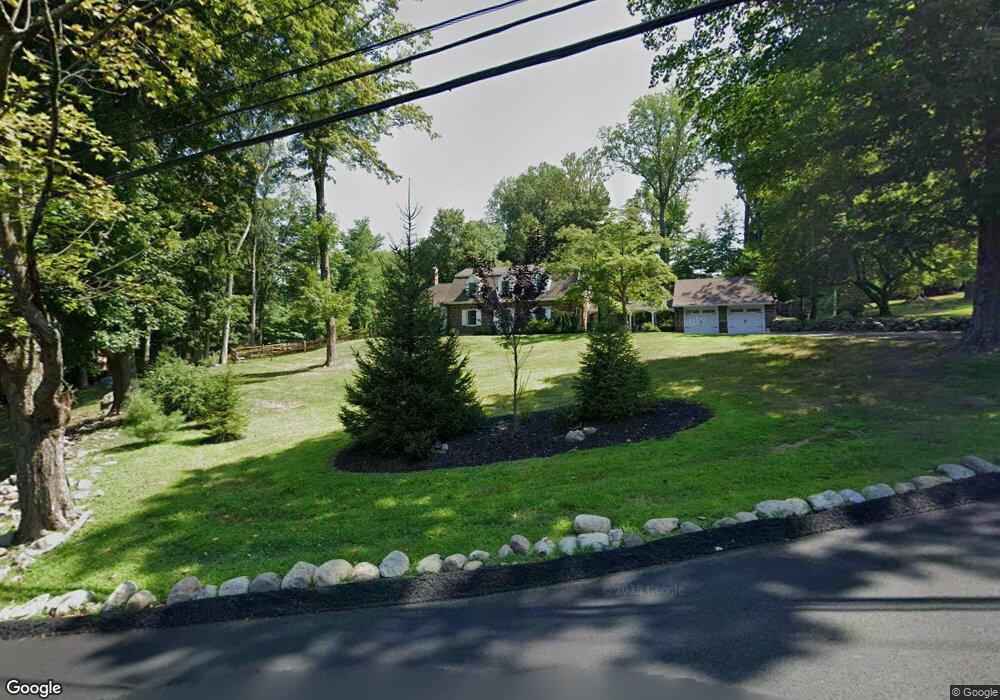
23 Locust Ln Upper Saddle River, NJ 07458
Estimated Value: $1,110,122 - $1,443,000
3
Beds
3
Baths
2,205
Sq Ft
$571/Sq Ft
Est. Value
About This Home
This home is located at 23 Locust Ln, Upper Saddle River, NJ 07458 and is currently estimated at $1,260,031, approximately $571 per square foot. 23 Locust Ln is a home located in Bergen County with nearby schools including Wandell Elementary School, Saddle River Day School, and St Joseph Regional High School.
Ownership History
Date
Name
Owned For
Owner Type
Purchase Details
Closed on
Jul 18, 2019
Sold by
Parron John
Bought by
Curatola Frank and Curatola Jean
Current Estimated Value
Home Financials for this Owner
Home Financials are based on the most recent Mortgage that was taken out on this home.
Original Mortgage
$712,000
Outstanding Balance
$618,120
Interest Rate
3.8%
Mortgage Type
Purchase Money Mortgage
Estimated Equity
$641,911
Purchase Details
Closed on
Aug 3, 2015
Sold by
Rispoli Frances J and Rispoli Heidi Hartung
Bought by
Parron John
Home Financials for this Owner
Home Financials are based on the most recent Mortgage that was taken out on this home.
Original Mortgage
$732,000
Interest Rate
4.08%
Mortgage Type
New Conventional
Purchase Details
Closed on
Sep 22, 2008
Home Financials for this Owner
Home Financials are based on the most recent Mortgage that was taken out on this home.
Original Mortgage
$585,000
Interest Rate
6.54%
Mortgage Type
New Conventional
Purchase Details
Closed on
Aug 29, 2001
Sold by
Rasmussen Emilie A
Bought by
Elling Joseph and Elling Elfi
Home Financials for this Owner
Home Financials are based on the most recent Mortgage that was taken out on this home.
Original Mortgage
$270,000
Interest Rate
6.91%
Create a Home Valuation Report for This Property
The Home Valuation Report is an in-depth analysis detailing your home's value as well as a comparison with similar homes in the area
Home Values in the Area
Average Home Value in this Area
Purchase History
| Date | Buyer | Sale Price | Title Company |
|---|---|---|---|
| Curatola Frank | $890,000 | -- | |
| Parron John | $915,000 | None Available | |
| -- | $1,000,000 | -- | |
| Elling Joseph | $599,000 | -- |
Source: Public Records
Mortgage History
| Date | Status | Borrower | Loan Amount |
|---|---|---|---|
| Open | Curatola Frank | $712,000 | |
| Previous Owner | Parron John | $732,000 | |
| Previous Owner | -- | $585,000 | |
| Previous Owner | Elling Joseph | $270,000 |
Source: Public Records
Tax History
| Year | Tax Paid | Tax Assessment Tax Assessment Total Assessment is a certain percentage of the fair market value that is determined by local assessors to be the total taxable value of land and additions on the property. | Land | Improvement |
|---|---|---|---|---|
| 2025 | $7,879 | $760,500 | $471,500 | $289,000 |
| 2024 | $7,765 | $760,500 | $471,500 | $289,000 |
| 2023 | $7,559 | $760,500 | $471,500 | $289,000 |
| 2022 | $7,559 | $760,500 | $471,500 | $289,000 |
| 2021 | $6,722 | $729,900 | $471,500 | $258,400 |
| 2020 | $7,000 | $729,900 | $471,500 | $258,400 |
| 2019 | $6,722 | $729,900 | $471,500 | $258,400 |
| 2018 | $6,613 | $729,900 | $471,500 | $258,400 |
| 2017 | $6,084 | $600,600 | $466,500 | $134,100 |
| 2016 | $6,120 | $600,600 | $466,500 | $134,100 |
| 2015 | $5,928 | $600,600 | $466,500 | $134,100 |
| 2014 | $5,868 | $600,600 | $466,500 | $134,100 |
Source: Public Records
Map
Nearby Homes
- 261 E Saddle River Rd
- 262 W Saddle River Rd
- 11 Aldbury Dr
- 11 Timberlane Rd
- 25 Ackerman Rd
- 64 Stoney Ridge Rd
- 48 Pleasant Ave
- 18 Wildwood Rd
- 70 Oak Dr
- 369 W Saddle River Rd
- 373 W Saddle River Rd
- 47 Fox Hedge Rd
- 95 Fox Hedge Rd
- 85 Oak Dr
- 7 Brookside Dr
- 22 Pembroke Trail
- 78 Woodmont Dr
- 3 Stonewall Ct
- 100 Lake St
- 202 Chestnut Ridge Rd
- 29 Locust Ln
- 24 Locust Ln
- 28 Drake Ln
- 286 E Saddle River Rd
- 22 Locust Ln
- 26 Locust Ln
- 288 E Saddle River Rd
- 33 Locust Ln
- 285 E Saddle River Rd
- 20 Upper Cross Rd
- 24 Drake Ln
- 270 E Saddle River Rd
- 271 E Saddle River Rd
- 27 Drake Ln
- 34 Locust Ln
- 15 Upper Cross Rd
- 23 Drake Ln
- 269 E Saddle River Rd
- 290 E Saddle River Rd
- 37 Locust Ln
Your Personal Tour Guide
Ask me questions while you tour the home.