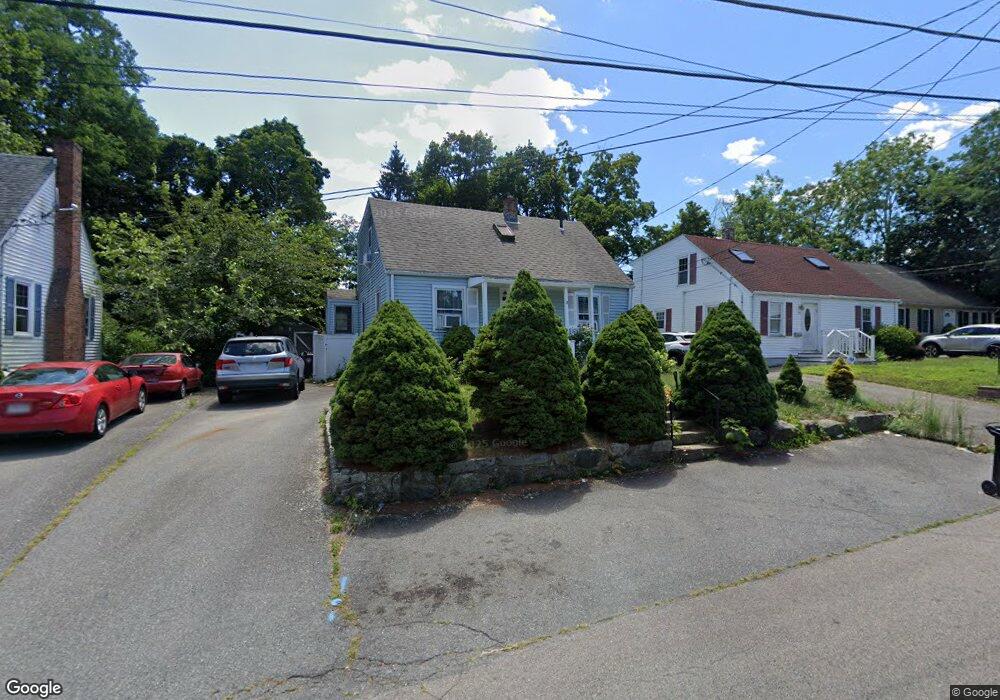
23 Locust St Brockton, MA 02301
Montello NeighborhoodEstimated Value: $483,517 - $516,000
4
Beds
1
Bath
1,400
Sq Ft
$357/Sq Ft
Est. Value
About This Home
This home is located at 23 Locust St, Brockton, MA 02301 and is currently estimated at $500,379, approximately $357 per square foot. 23 Locust St is a home located in Plymouth County with nearby schools including Raymond K-8 Elementary School, Louis F Angelo Elementary School, and Manthala George Jr. School.
Ownership History
Date
Name
Owned For
Owner Type
Purchase Details
Closed on
Dec 23, 2004
Sold by
Dixon Firzroy and Massieu Jeanne
Bought by
Itacy Louis
Current Estimated Value
Home Financials for this Owner
Home Financials are based on the most recent Mortgage that was taken out on this home.
Original Mortgage
$236,000
Interest Rate
5.74%
Mortgage Type
Purchase Money Mortgage
Purchase Details
Closed on
Jun 30, 2000
Sold by
Coffin James and Coffin Janice
Bought by
Dixon Fitzroy and Massieu Jeanne
Create a Home Valuation Report for This Property
The Home Valuation Report is an in-depth analysis detailing your home's value as well as a comparison with similar homes in the area
Home Values in the Area
Average Home Value in this Area
Purchase History
| Date | Buyer | Sale Price | Title Company |
|---|---|---|---|
| Itacy Louis | $295,000 | -- | |
| Dixon Fitzroy | $153,400 | -- |
Source: Public Records
Mortgage History
| Date | Status | Borrower | Loan Amount |
|---|---|---|---|
| Open | Dixon Fitzroy | $268,000 | |
| Closed | Dixon Fitzroy | $50,250 | |
| Closed | Dixon Fitzroy | $236,000 | |
| Closed | Dixon Fitzroy | $59,000 |
Source: Public Records
Tax History Compared to Growth
Tax History
| Year | Tax Paid | Tax Assessment Tax Assessment Total Assessment is a certain percentage of the fair market value that is determined by local assessors to be the total taxable value of land and additions on the property. | Land | Improvement |
|---|---|---|---|---|
| 2025 | $5,037 | $415,900 | $139,100 | $276,800 |
| 2024 | $4,800 | $399,300 | $139,100 | $260,200 |
| 2023 | $4,478 | $345,000 | $103,500 | $241,500 |
| 2022 | $4,366 | $312,500 | $94,000 | $218,500 |
| 2021 | $4,003 | $276,100 | $77,900 | $198,200 |
| 2020 | $4,036 | $266,400 | $73,200 | $193,200 |
| 2019 | $3,823 | $246,000 | $71,300 | $174,700 |
| 2018 | $3,928 | $244,600 | $71,300 | $173,300 |
| 2017 | $3,241 | $201,300 | $71,300 | $130,000 |
| 2016 | $3,241 | $186,700 | $69,000 | $117,700 |
| 2015 | $3,078 | $169,600 | $69,000 | $100,600 |
| 2014 | $2,964 | $163,500 | $69,000 | $94,500 |
Source: Public Records
Map
Nearby Homes