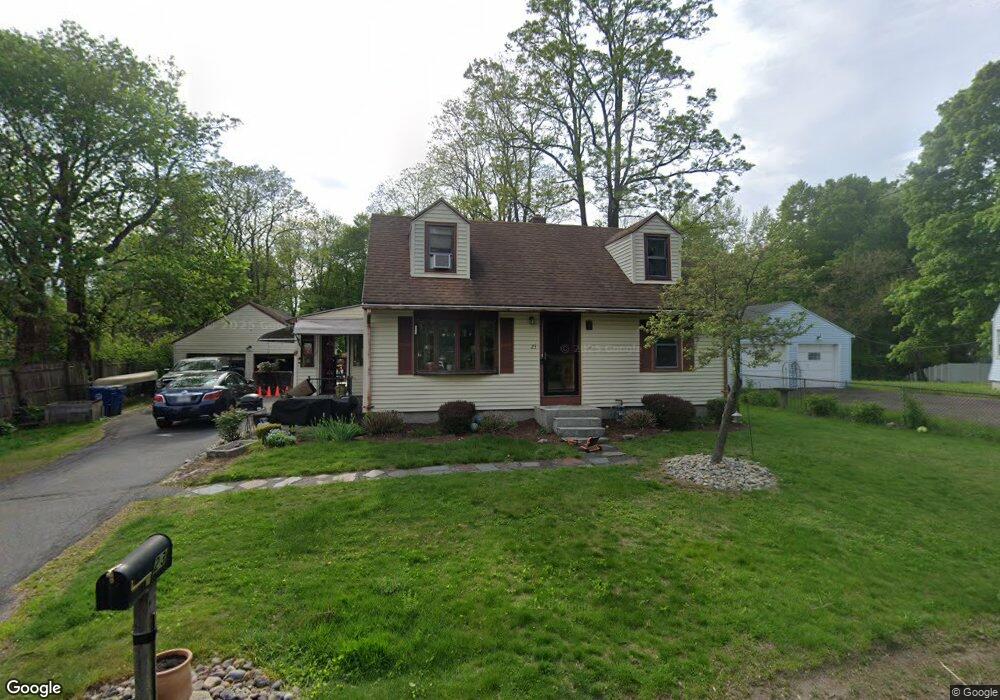
23 Locust St West Springfield, MA 01089
Estimated Value: $257,000 - $348,000
3
Beds
1
Bath
1,037
Sq Ft
$297/Sq Ft
Est. Value
About This Home
This home is located at 23 Locust St, West Springfield, MA 01089 and is currently estimated at $307,485, approximately $296 per square foot. 23 Locust St is a home located in Hampden County with nearby schools including St Thomas The Apostle School.
Ownership History
Date
Name
Owned For
Owner Type
Purchase Details
Closed on
Jun 7, 1999
Sold by
Crocker John A and White Judith A
Bought by
Bost Donna
Current Estimated Value
Home Financials for this Owner
Home Financials are based on the most recent Mortgage that was taken out on this home.
Original Mortgage
$96,000
Outstanding Balance
$24,902
Interest Rate
6.85%
Mortgage Type
Purchase Money Mortgage
Estimated Equity
$282,583
Purchase Details
Closed on
Mar 25, 1992
Sold by
Crocker John E and Crocker Mary S
Bought by
Crocker John A and White Judith A
Create a Home Valuation Report for This Property
The Home Valuation Report is an in-depth analysis detailing your home's value as well as a comparison with similar homes in the area
Home Values in the Area
Average Home Value in this Area
Purchase History
| Date | Buyer | Sale Price | Title Company |
|---|---|---|---|
| Bost Donna | $120,000 | -- | |
| Crocker John A | $125,000 | -- |
Source: Public Records
Mortgage History
| Date | Status | Borrower | Loan Amount |
|---|---|---|---|
| Open | Crocker John A | $96,000 |
Source: Public Records
Tax History Compared to Growth
Tax History
| Year | Tax Paid | Tax Assessment Tax Assessment Total Assessment is a certain percentage of the fair market value that is determined by local assessors to be the total taxable value of land and additions on the property. | Land | Improvement |
|---|---|---|---|---|
| 2025 | $3,909 | $262,900 | $121,900 | $141,000 |
| 2024 | $3,908 | $263,900 | $121,900 | $142,000 |
| 2023 | $3,705 | $238,400 | $121,900 | $116,500 |
| 2022 | $3,398 | $215,600 | $110,800 | $104,800 |
| 2021 | $3,321 | $196,500 | $105,400 | $91,100 |
| 2020 | $3,332 | $196,100 | $105,400 | $90,700 |
| 2019 | $3,326 | $196,100 | $105,400 | $90,700 |
| 2018 | $3,344 | $196,100 | $105,400 | $90,700 |
| 2017 | $3,344 | $196,100 | $105,400 | $90,700 |
| 2016 | $3,294 | $193,900 | $101,500 | $92,400 |
| 2015 | $3,230 | $190,100 | $99,400 | $90,700 |
| 2014 | $784 | $190,100 | $99,400 | $90,700 |
Source: Public Records
Map
Nearby Homes
- 148 Craiwell Ave
- 167 Wolcott Ave
- 180 Wolcott Ave
- 260 Wolcott Ave
- 258 Poplar Ave
- 43 Houston Rd
- 416 Hillcrest Ave
- 8 Ridgeview Dr
- 514 Dewey St
- 16 North St
- 31 Stone Path Ln
- 0 E Mountain Rd
- 189 Springfield Rd Unit 23
- 719 N West St
- 99 Valley Brook Rd
- 283 Forest Glen
- 65 Verdugo St
- 0 Feeding Hills Rd
- 103 Feeding Hills Rd
- 142 Morton St
- 31 Locust St
- 71 Sibley Ave
- 2306 Westfield St
- 61 Sibley Ave
- 77 Sibley Ave
- 51 Sibley Ave
- 83 Sibley Ave
- 2284 Westfield St
- 2260 Westfield St
- 2260 Westfield St Unit 5
- 2260 Westfield St Unit 3
- 2260 Westfield St Unit 6
- 2260 Westfield St Unit 4
- 2260 Westfield St Unit 2
- 66 Sibley Ave
- 101 Sibley Ave
- 2287 Westfield St
- 58 Sibley Ave
- 42 Sibley Ave
- 2275 Westfield St