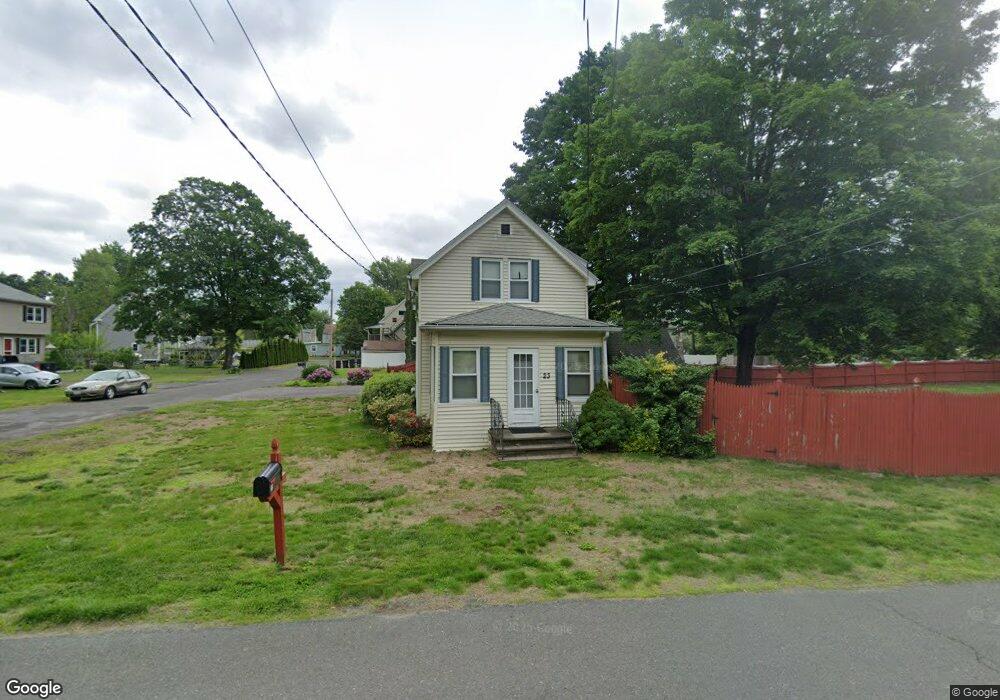
23 Lois St Westfield, MA 01085
Estimated Value: $331,000 - $385,580
3
Beds
2
Baths
1,410
Sq Ft
$262/Sq Ft
Est. Value
About This Home
This home is located at 23 Lois St, Westfield, MA 01085 and is currently estimated at $368,895, approximately $261 per square foot. 23 Lois St is a home located in Hampden County with nearby schools including Westfield High School and Saint Mary High School.
Ownership History
Date
Name
Owned For
Owner Type
Purchase Details
Closed on
Feb 5, 2015
Sold by
Barratt Roger A
Bought by
Barratt Jennifer
Current Estimated Value
Purchase Details
Closed on
Jul 31, 2006
Sold by
Iglesias Michelle L
Bought by
Barratt Roger A
Purchase Details
Closed on
Jun 11, 1999
Sold by
Johnson Dorothy A
Bought by
Iglesias Michelle L
Create a Home Valuation Report for This Property
The Home Valuation Report is an in-depth analysis detailing your home's value as well as a comparison with similar homes in the area
Home Values in the Area
Average Home Value in this Area
Purchase History
| Date | Buyer | Sale Price | Title Company |
|---|---|---|---|
| Barratt Jennifer | -- | -- | |
| Barratt Roger A | $94,000 | -- | |
| Iglesias Michelle L | $87,000 | -- |
Source: Public Records
Mortgage History
| Date | Status | Borrower | Loan Amount |
|---|---|---|---|
| Previous Owner | Iglesias Michelle L | $40,000 | |
| Previous Owner | Iglesias Michelle L | $122,000 | |
| Previous Owner | Iglesias Michelle L | $128,000 |
Source: Public Records
Tax History Compared to Growth
Tax History
| Year | Tax Paid | Tax Assessment Tax Assessment Total Assessment is a certain percentage of the fair market value that is determined by local assessors to be the total taxable value of land and additions on the property. | Land | Improvement |
|---|---|---|---|---|
| 2025 | $5,255 | $346,200 | $192,200 | $154,000 |
| 2024 | $5,053 | $316,400 | $174,800 | $141,600 |
| 2023 | $48 | $290,900 | $166,400 | $124,500 |
| 2022 | $4,757 | $257,300 | $148,400 | $108,900 |
| 2021 | $4,586 | $242,900 | $140,200 | $102,700 |
| 2020 | $4,526 | $235,100 | $140,200 | $94,900 |
| 2019 | $4,402 | $223,800 | $133,600 | $90,200 |
| 2018 | $4,333 | $223,800 | $133,600 | $90,200 |
| 2017 | $4,325 | $222,700 | $135,600 | $87,100 |
| 2016 | $4,329 | $222,700 | $135,600 | $87,100 |
| 2015 | $4,129 | $222,700 | $135,600 | $87,100 |
| 2014 | $3,088 | $222,700 | $135,600 | $87,100 |
Source: Public Records
Map
Nearby Homes
- 70 S Maple St
- 74 S Maple St
- 70-74 S Maple St
- 82 S Maple St Unit 43
- 82 S Maple St Unit 11
- 172 Valley View Dr
- 128 Crane Ave
- 16 Yale St
- 15 Bates St
- 69 Beveridge Blvd
- 13 King Place
- 78 Granville Rd Unit 11
- 51 Washington St
- 113 Franklin St
- 33 George St
- 11 Highland Cir
- 138 Main St Unit 13
- 138 Main St Unit 11
- 77 Orange St
- 8 Ellis St