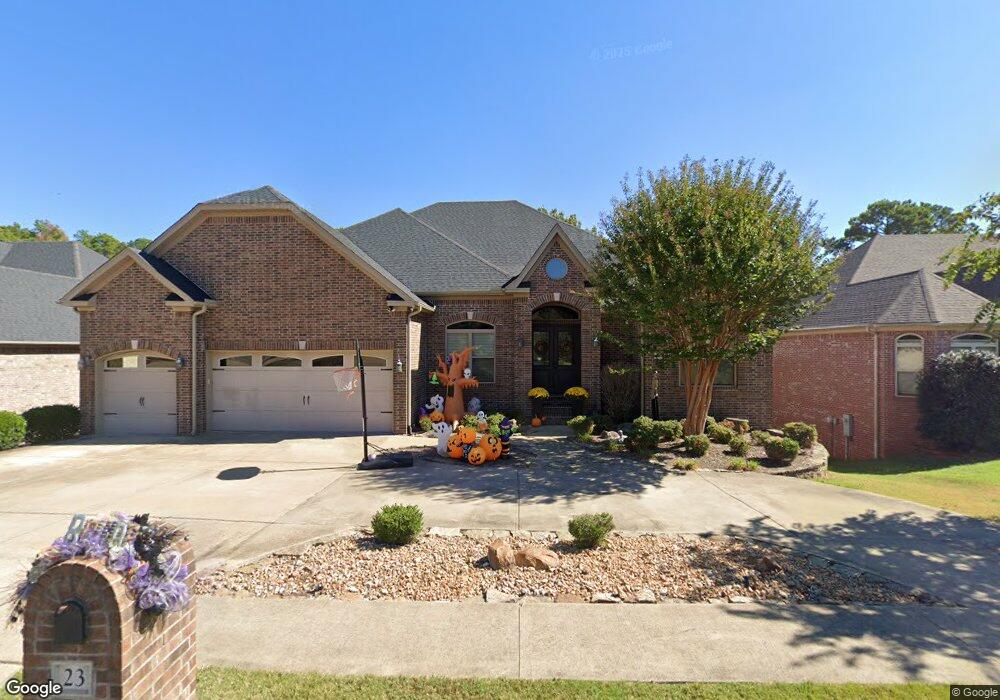
23 Longwell Loop Little Rock, AR 72211
Rock Creek NeighborhoodEstimated Value: $615,000 - $662,000
4
Beds
4
Baths
4,260
Sq Ft
$151/Sq Ft
Est. Value
About This Home
This home is located at 23 Longwell Loop, Little Rock, AR 72211 and is currently estimated at $645,089, approximately $151 per square foot. 23 Longwell Loop is a home located in Pulaski County with nearby schools including Baker Interdistrict Elementary School, Joe T. Robinson Middle School, and Joe T. Robinson High School.
Ownership History
Date
Name
Owned For
Owner Type
Purchase Details
Closed on
Jun 14, 2018
Sold by
Bartlett Mark and Bartlett Misty
Bought by
Nosler Matt and Nosler Trena
Current Estimated Value
Home Financials for this Owner
Home Financials are based on the most recent Mortgage that was taken out on this home.
Original Mortgage
$429,551
Outstanding Balance
$371,490
Interest Rate
4.5%
Mortgage Type
Future Advance Clause Open End Mortgage
Estimated Equity
$273,599
Purchase Details
Closed on
Sep 7, 2011
Sold by
Mj Innovative Builders Corp
Bought by
Bartlett Mark and Bartlett Misty
Home Financials for this Owner
Home Financials are based on the most recent Mortgage that was taken out on this home.
Original Mortgage
$432,000
Interest Rate
4.58%
Mortgage Type
Future Advance Clause Open End Mortgage
Purchase Details
Closed on
May 29, 2009
Sold by
Peters Realty Inc
Bought by
Mj Innovative Builders Inc
Purchase Details
Closed on
Apr 30, 2007
Sold by
Winrock Development Co
Bought by
Peters Realty Inc
Create a Home Valuation Report for This Property
The Home Valuation Report is an in-depth analysis detailing your home's value as well as a comparison with similar homes in the area
Home Values in the Area
Average Home Value in this Area
Purchase History
| Date | Buyer | Sale Price | Title Company |
|---|---|---|---|
| Nosler Matt | $429,551 | None Available | |
| Bartlett Mark | $482,000 | Lenders Title Company | |
| Mj Innovative Builders Inc | $65,000 | American Abstract & Title Co | |
| Peters Realty Inc | $65,000 | None Available |
Source: Public Records
Mortgage History
| Date | Status | Borrower | Loan Amount |
|---|---|---|---|
| Open | Nosler Matt | $429,551 | |
| Previous Owner | Bartlett Mark | $432,000 |
Source: Public Records
Tax History
| Year | Tax Paid | Tax Assessment Tax Assessment Total Assessment is a certain percentage of the fair market value that is determined by local assessors to be the total taxable value of land and additions on the property. | Land | Improvement |
|---|---|---|---|---|
| 2025 | $6,858 | $106,660 | $7,800 | $98,860 |
| 2024 | $6,834 | $106,660 | $7,800 | $98,860 |
| 2023 | $6,834 | $106,660 | $7,800 | $98,860 |
| 2022 | $6,265 | $106,660 | $7,800 | $98,860 |
| 2021 | $5,739 | $88,570 | $10,200 | $78,370 |
| 2020 | $5,695 | $88,570 | $10,200 | $78,370 |
| 2019 | $5,695 | $88,570 | $10,200 | $78,370 |
| 2018 | $5,695 | $88,570 | $10,200 | $78,370 |
| 2017 | $5,695 | $88,570 | $10,200 | $78,370 |
| 2016 | $5,402 | $84,010 | $12,000 | $72,010 |
| 2015 | $5,444 | $84,010 | $12,000 | $72,010 |
| 2014 | $5,444 | $84,010 | $12,000 | $72,010 |
Source: Public Records
Map
Nearby Homes
- 17 Glasgow Ct
- 307 Wellington Woods Loop
- 410 Wellington Woods Loop
- 101 Blackburn Dr
- 2006 Wellington Woods Dr
- 2110 Wellington Plantation Dr
- 24 Wellington Colony Dr
- 1606 Wetherborne Dr
- 14812 Chambery Dr
- 15 Roanne Ct
- 14904 Lamplight Way
- 14620 Chambery Dr
- 414 Parliament St
- 14500 Saint Michael Dr
- 11 Mountain View Ct
- 2104 Huntleigh Ct
- 714 Loyola Dr
- 14700 Woodcreek Dr
- 801 Loyola Dr
- 1 Saint Thomas Ct
- 21 Longwell Loop
- 25 Longwell Loop
- 0 Longwell Loop Unit 15031603
- 19 Longwell Loop
- 29 Longwell Loop
- 22 Longwell Loop
- 24 Longwell Loop
- 20 Longwell Loop
- 28 Longwell Loop
- 18 Longwell Loop
- 17 Longwell Loop
- 33 Longwell Loop
- 33 Glasgow Ct
- 35 Glasgow Ct
- 31 Glasgow Ct
- 16 Longwell Loop
- 36 Longwell Loop
- 29 Glasgow Ct
- 112 Weston Place
- 35 Longwell Loop
Your Personal Tour Guide
Ask me questions while you tour the home.