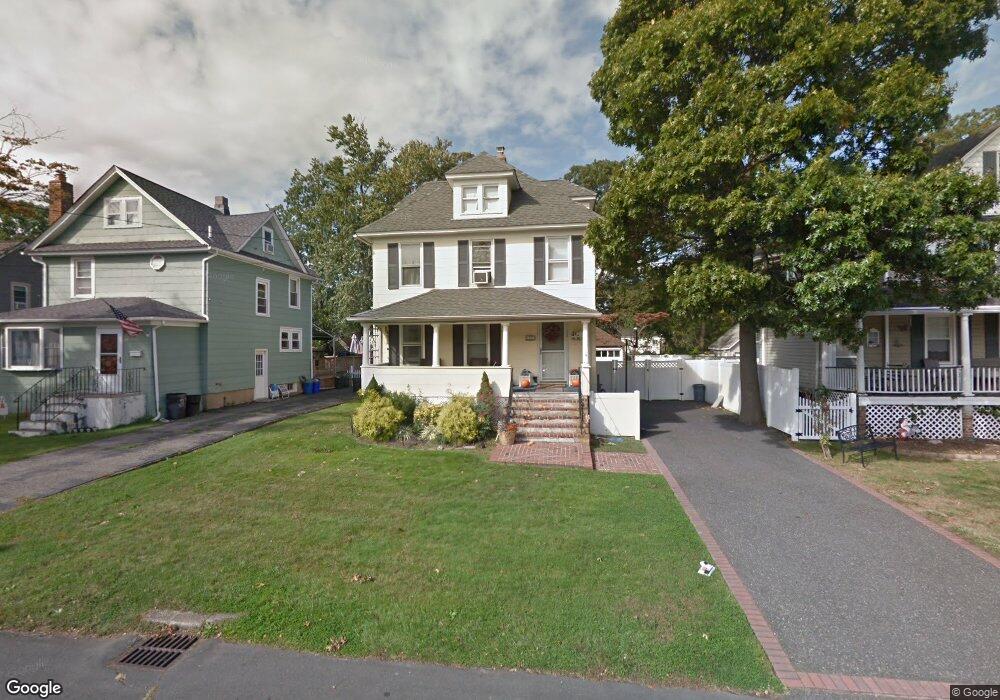
23 Maple St West Babylon, NY 11704
Estimated Value: $573,188 - $652,000
Studio
--
Bath
1,400
Sq Ft
$447/Sq Ft
Est. Value
About This Home
This home is located at 23 Maple St, West Babylon, NY 11704 and is currently estimated at $625,297, approximately $446 per square foot. 23 Maple St is a home located in Suffolk County with nearby schools including West Babylon Senior High School and South Bay Junior Academy.
Ownership History
Date
Name
Owned For
Owner Type
Purchase Details
Closed on
Feb 25, 2010
Sold by
Mullan Ann M and Flynn Ann M
Bought by
Flynn Ann M
Current Estimated Value
Home Financials for this Owner
Home Financials are based on the most recent Mortgage that was taken out on this home.
Original Mortgage
$329,873
Interest Rate
5.12%
Mortgage Type
FHA
Purchase Details
Closed on
Oct 10, 2001
Sold by
Haugen Patrick Michael
Bought by
Mullan Ann M
Home Financials for this Owner
Home Financials are based on the most recent Mortgage that was taken out on this home.
Original Mortgage
$191,200
Interest Rate
6.93%
Purchase Details
Closed on
Jan 25, 2000
Sold by
Haugen Patrick Michael and Haugen Jean Mae
Bought by
Haugen Patrick Michael
Home Financials for this Owner
Home Financials are based on the most recent Mortgage that was taken out on this home.
Original Mortgage
$128,000
Interest Rate
8.21%
Create a Home Valuation Report for This Property
The Home Valuation Report is an in-depth analysis detailing your home's value as well as a comparison with similar homes in the area
Home Values in the Area
Average Home Value in this Area
Purchase History
| Date | Buyer | Sale Price | Title Company |
|---|---|---|---|
| Flynn Ann M | -- | -- | |
| Mullan Ann M | $239,000 | Fidelity National Title Ins | |
| Haugen Patrick Michael | -- | -- |
Source: Public Records
Mortgage History
| Date | Status | Borrower | Loan Amount |
|---|---|---|---|
| Previous Owner | Flynn Ann M | $329,873 | |
| Previous Owner | Mullan Ann M | $191,200 | |
| Previous Owner | Haugen Patrick Michael | $128,000 |
Source: Public Records
Tax History
| Year | Tax Paid | Tax Assessment Tax Assessment Total Assessment is a certain percentage of the fair market value that is determined by local assessors to be the total taxable value of land and additions on the property. | Land | Improvement |
|---|---|---|---|---|
| 2024 | $10,747 | $3,540 | $230 | $3,310 |
| 2023 | $10,747 | $2,790 | $230 | $2,560 |
| 2022 | $7,778 | $2,790 | $230 | $2,560 |
| 2021 | $7,778 | $2,790 | $230 | $2,560 |
| 2020 | $8,203 | $2,790 | $230 | $2,560 |
| 2019 | $8,203 | $0 | $0 | $0 |
| 2018 | $7,695 | $2,790 | $230 | $2,560 |
| 2017 | $7,695 | $2,790 | $230 | $2,560 |
| 2016 | $7,687 | $2,790 | $230 | $2,560 |
| 2015 | -- | $2,790 | $230 | $2,560 |
| 2014 | -- | $2,790 | $230 | $2,560 |
Source: Public Records
Map
Nearby Homes
- 49 Arnold Ave
- 45 Arnold Ave
- 64 Nehring Ave
- 252 Locust Ave
- 243 Locust Ave
- 24 Lowerre St
- 37 Beachwood Dr
- 359 Park Ave
- 234 Millard Ave Unit 234
- 64 Nill St
- 79 Woodrow Pkwy
- 104 Frederick Ave
- 154A Woodrow Pkwy
- 24 Raynor St
- 9 Pratt St
- 248 Arnold Ave
- 14 Blanchard St
- 104 Hawthorne Ave
- 19 Gamecock Ln
- 6 Glenda Dr
Your Personal Tour Guide
Ask me questions while you tour the home.