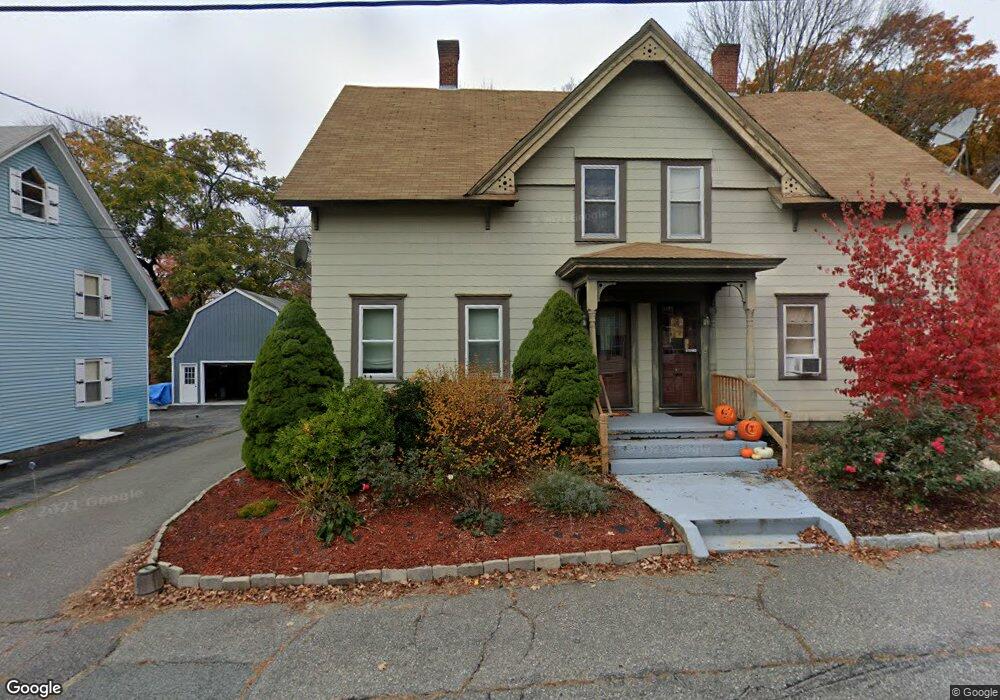
23 Maple St Whitinsville, MA 01588
Estimated Value: $286,000 - $332,000
3
Beds
2
Baths
1,268
Sq Ft
$245/Sq Ft
Est. Value
About This Home
This home is located at 23 Maple St, Whitinsville, MA 01588 and is currently estimated at $310,294, approximately $244 per square foot. 23 Maple St is a home located in Worcester County with nearby schools including Northbridge Elementary School, Northbridge Middle School, and Northbridge High School.
Ownership History
Date
Name
Owned For
Owner Type
Purchase Details
Closed on
Sep 15, 2009
Sold by
Cenlar Fsb and Us Bk
Bought by
Daley John E and Daley Jeanne M
Current Estimated Value
Purchase Details
Closed on
Sep 2, 2009
Sold by
Sullivan Sarah R and Cenlar Fsb
Bought by
Us Bk and Bafh-H
Purchase Details
Closed on
May 26, 2006
Sold by
Martin Justin T and Martin Melinda R
Bought by
Sullivan Sarah R and Sullivan Sean P
Home Financials for this Owner
Home Financials are based on the most recent Mortgage that was taken out on this home.
Original Mortgage
$199,000
Interest Rate
6.53%
Mortgage Type
Purchase Money Mortgage
Purchase Details
Closed on
Apr 20, 2001
Sold by
Kidd Gary D and Kidd Christine A
Bought by
Rosenthal Tammy Lynn
Home Financials for this Owner
Home Financials are based on the most recent Mortgage that was taken out on this home.
Original Mortgage
$122,500
Interest Rate
6.9%
Mortgage Type
Purchase Money Mortgage
Create a Home Valuation Report for This Property
The Home Valuation Report is an in-depth analysis detailing your home's value as well as a comparison with similar homes in the area
Home Values in the Area
Average Home Value in this Area
Purchase History
| Date | Buyer | Sale Price | Title Company |
|---|---|---|---|
| Daley John E | $89,900 | -- | |
| Daley John E | $89,900 | -- | |
| Us Bk | $184,500 | -- | |
| Us Bk | $184,500 | -- | |
| Sullivan Sarah R | $199,000 | -- | |
| Sullivan Sarah R | $199,000 | -- | |
| Rosenthal Tammy Lynn | $129,000 | -- | |
| Rosenthal Tammy Lynn | $129,000 | -- |
Source: Public Records
Mortgage History
| Date | Status | Borrower | Loan Amount |
|---|---|---|---|
| Previous Owner | Sullivan Sarah R | $199,000 | |
| Previous Owner | Rosenthal Tammy Lynn | $122,500 |
Source: Public Records
Tax History Compared to Growth
Tax History
| Year | Tax Paid | Tax Assessment Tax Assessment Total Assessment is a certain percentage of the fair market value that is determined by local assessors to be the total taxable value of land and additions on the property. | Land | Improvement |
|---|---|---|---|---|
| 2025 | $2,788 | $236,500 | $0 | $236,500 |
| 2024 | $2,530 | $209,300 | $0 | $209,300 |
| 2023 | $2,551 | $196,800 | $0 | $196,800 |
| 2022 | $2,435 | $176,800 | $0 | $176,800 |
| 2021 | $2,194 | $151,400 | $0 | $151,400 |
| 2020 | $2,015 | $145,600 | $0 | $145,600 |
| 2019 | $1,812 | $139,700 | $0 | $139,700 |
| 2018 | $1,676 | $129,500 | $0 | $129,500 |
| 2017 | $1,706 | $126,100 | $0 | $126,100 |
| 2016 | $1,777 | $129,200 | $0 | $129,200 |
| 2015 | $1,729 | $129,200 | $0 | $129,200 |
| 2014 | $1,663 | $125,400 | $0 | $125,400 |
Source: Public Records
Map
Nearby Homes
- 24 Crescent St Unit 6
- 11 A St Unit 11
- Lots 1-9 Spring St
- 9 Banning Dr
- 14 C St Unit 24
- 14 C St Unit 14
- 1 Elm St
- 2 D St
- 90 Nathaniel Dr
- 128 Linwood Ave
- 18 East St Unit 24
- 46 Rebecca Rd
- 192 Rebecca Rd
- 894 Marston Rd
- 708 Marston Rd
- 3 Bayliss Way
- 22 Bayliss Way
- 21 Granite St
- 26 Bayliss Way
- 121 East St Unit 121
- 21 Maple St Unit 21A
- 21 Maple St
- 19 Maple St
- 19 Maple St Unit 19
- 27 Maple St
- 25 Maple St
- 27 Maple St Unit B
- 25 Maple St Unit 1
- 27 Maple St Unit 1
- 17 Maple St Unit 19
- 18 Maple St
- 18 Maple St Unit A
- 18 Maple St Unit 18
- 22 Maple St Unit 24
- 28 Maple St
- 26 Maple St
- 28 Maple St Unit 32
- 28 Maple St Unit 2,1
- 28 Maple St Unit 28
- 20 Maple St