Estimated Value: $250,084 - $361,000
--
Bed
--
Bath
1,953
Sq Ft
$162/Sq Ft
Est. Value
About This Home
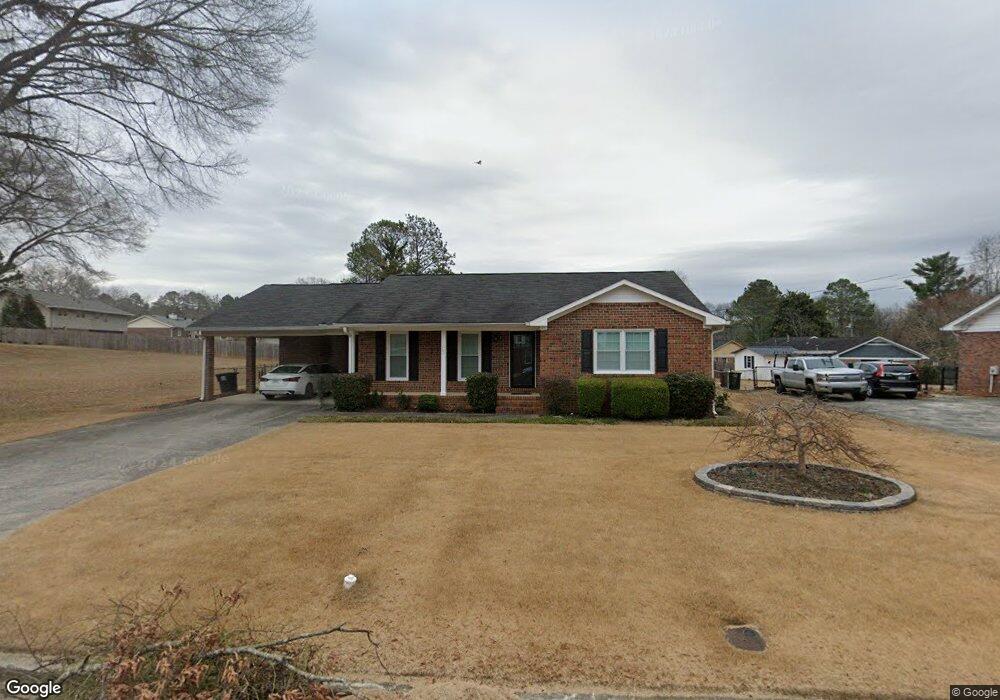
This home is located at 23 Maplewood Square SE, Rome, GA 30161 and is currently estimated at $317,271, approximately $162 per square foot. 23 Maplewood Square SE is a home located in Floyd County with nearby schools including Rome High School, St. Mary School, and Darlington School.
Ownership History
Date
Name
Owned For
Owner Type
Purchase Details
Closed on
Aug 30, 2000
Sold by
Stuart Robert T
Bought by
Stephens Gwendolyn J
Current Estimated Value
Purchase Details
Closed on
Jan 28, 1994
Sold by
Wada Metal Of America Corporation
Bought by
Stuart Robert T
Purchase Details
Closed on
Nov 23, 1993
Sold by
Chambers Donald E and Chambers Rebecca
Bought by
Wada Metal Of America Corporation
Purchase Details
Closed on
Apr 20, 1979
Sold by
Henderson Louise D
Bought by
Chambers Donald E and Chambers Rebecca
Purchase Details
Closed on
Aug 22, 1977
Sold by
Jones Sidney M and Jones Doris
Bought by
Henderson Louise D
Purchase Details
Closed on
Oct 25, 1974
Sold by
Howell Howell and Howell Covington
Bought by
Jones Sidney M and Jones Doris
Purchase Details
Closed on
Jun 21, 1971
Bought by
P and R
Purchase Details
Closed on
Apr 5, 1968
Sold by
Howell Howell and Howell Covington
Bought by
Williams Const Co Of Rome
Purchase Details
Closed on
Aug 15, 1967
Bought by
Howell Howell and Howell Covington
Create a Home Valuation Report for This Property
The Home Valuation Report is an in-depth analysis detailing your home's value as well as a comparison with similar homes in the area
Home Values in the Area
Average Home Value in this Area
Purchase History
| Date | Buyer | Sale Price | Title Company |
|---|---|---|---|
| Stephens Gwendolyn J | $118,000 | -- | |
| Stuart Robert T | $91,000 | -- | |
| Wada Metal Of America Corporation | $87,000 | -- | |
| Chambers Donald E | $44,300 | -- | |
| Henderson Louise D | $39,000 | -- | |
| Jones Sidney M | $39,000 | -- | |
| P | -- | -- | |
| Howell Howell | -- | -- | |
| Williams Const Co Of Rome | -- | -- | |
| Howell Howell | -- | -- |
Source: Public Records
Tax History Compared to Growth
Tax History
| Year | Tax Paid | Tax Assessment Tax Assessment Total Assessment is a certain percentage of the fair market value that is determined by local assessors to be the total taxable value of land and additions on the property. | Land | Improvement |
|---|---|---|---|---|
| 2024 | $1,615 | $91,632 | $11,174 | $80,458 |
| 2023 | $2,273 | $88,734 | $10,127 | $78,607 |
| 2022 | $2,047 | $74,525 | $8,381 | $66,144 |
| 2021 | $1,876 | $62,972 | $8,381 | $54,591 |
| 2020 | $1,815 | $58,776 | $6,460 | $52,316 |
| 2019 | $1,712 | $53,751 | $6,460 | $47,291 |
| 2018 | $1,671 | $51,356 | $6,460 | $44,896 |
| 2017 | $1,653 | $50,320 | $6,460 | $43,860 |
| 2016 | $1,646 | $49,680 | $6,440 | $43,240 |
| 2015 | $1,572 | $50,400 | $6,440 | $43,960 |
| 2014 | $1,572 | $50,111 | $6,440 | $43,671 |
Source: Public Records
Map
Nearby Homes
- 26 Maplewood Square SE
- 22 Oakfield Dr SE
- 20 Mitchell Cir SE
- 4 Mitchell Cir SE
- 227 W Lakeshore Dr SE
- 100 Valley Brook Dr SE
- 14 Laurchris Dr SE
- 0 Lakeshore Dr
- 9 Heather Rd SE
- 11 Surrey Trail SE
- 6 Woodland Dr SE
- 4 Coach Trail SE
- 226 Maplecrest Ln SE
- 120 Keown Rd SE
- 15 Mimosa Dr SE
- 6 Haley Dr SE
- 0 Georgia 293
- 11 Breckenridge Rd SE
- 13 Breckenridge Rd SE
- 25 Maplewood Square SE
- 27 Maplewood Square SE
- 19 Maplewood Square SE
- 19 Maplewood Square SE
- 19 Maplewood Square SE Unit 34
- 22 Maplewood Square SE
- 29 Maplewood Square SE
- 17 Maplewood Square SE
- 20 Maplewood Square SE
- 24 Maplewood Square SE
- 18 Maplewood Square SE
- 31 Maplewood Square SE
- 28 Maplewood Square Squarese
- 30 Maplewood Square SE
- 15 Maplewood Square SE
- 32 Maplewood Square SE Unit 16
- 32 Maplewood Square SE
- 28 Maplewood Square SE
- 16 Maplewood Square SE
- 33 Maplewood Square SE