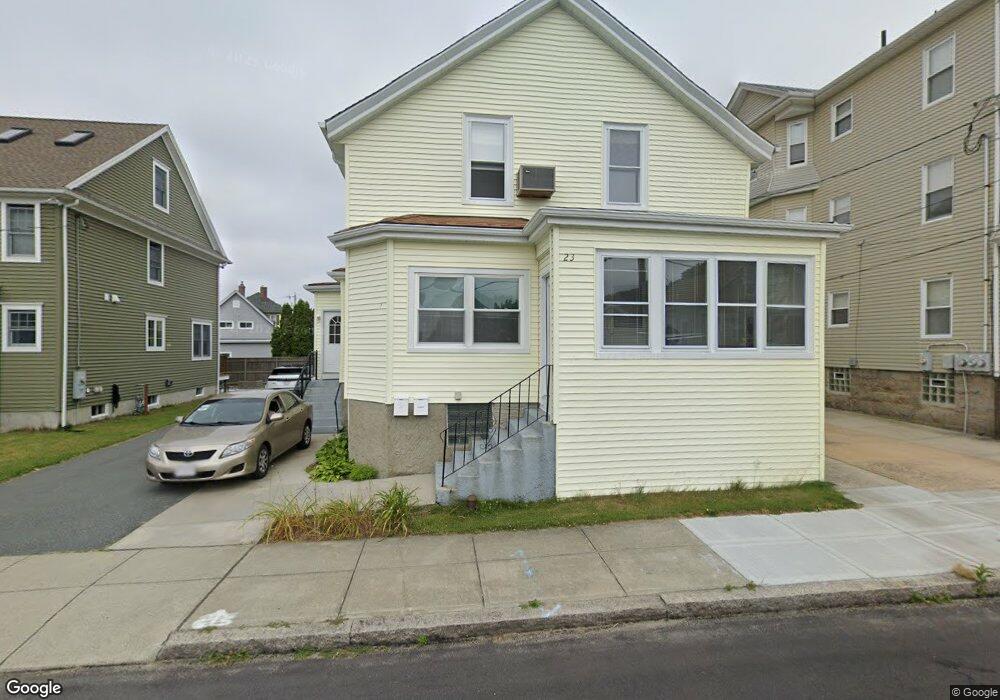
23 Marsh St Unit 2 Fall River, MA 02723
Flint NeighborhoodEstimated Value: $463,002 - $604,000
About This Home
This home is located at 23 Marsh St Unit 2, Fall River, MA 02723 and is currently estimated at $528,501, approximately $235 per square foot. 23 Marsh St Unit 2 is a home located in Bristol County with nearby schools including Mary Fonseca Elementary School, Talbot Innovation School, and B M C Durfee High School.
Ownership History
We collect this data history from publicly available records. To have your information removed, we recommend requesting removal directly through your county’s website.
Purchase Details
Purchase Details
Purchase Details
Home Values in the Area
Average Home Value in this Area
Purchase History
We collect this data history from publicly available records. To have your information removed, we recommend requesting removal directly through your county’s website.
| Date | Buyer | Sale Price | Title Company |
|---|---|---|---|
| -- | None Available | ||
| -- | -- | ||
| $70,000 | -- |
Mortgage History
We collect this data history from publicly available records. To have your information removed, we recommend requesting removal directly through your county’s website.
| Date | Status | Borrower | Loan Amount |
|---|---|---|---|
| Previous Owner | $212,000 | ||
| Previous Owner | $160,000 | ||
| Previous Owner | $75,000 |
Tax History
We collect this data history from publicly available records. To have your information removed, we recommend requesting removal directly through your county’s website.
| Year | Tax Paid | Tax Assessment Tax Assessment Total Assessment is a certain percentage of the fair market value that is determined by local assessors to be the total taxable value of land and additions on the property. | Land | Improvement |
|---|---|---|---|---|
| 2025 | $4,983 | $435,200 | $114,700 | $320,500 |
| 2024 | $4,585 | $399,000 | $112,400 | $286,600 |
| 2023 | $4,223 | $344,200 | $101,300 | $242,900 |
| 2022 | $3,907 | $309,600 | $95,600 | $214,000 |
| 2021 | $3,514 | $254,100 | $91,300 | $162,800 |
| 2020 | $3,143 | $217,500 | $87,100 | $130,400 |
| 2019 | $3,091 | $212,000 | $91,100 | $120,900 |
| 2018 | $2,727 | $186,500 | $91,700 | $94,800 |
| 2017 | $2,537 | $181,200 | $91,700 | $89,500 |
| 2016 | $2,477 | $181,700 | $94,500 | $87,200 |
| 2015 | $2,377 | $181,700 | $94,500 | $87,200 |
| 2014 | $2,385 | $189,600 | $94,500 | $95,100 |
Map
- 124 Downing St
- 45 Lafayette St
- 367 County St
- 41 Barnes St
- 149 Mason St
- 349 County St
- 212 Haffards St
- 155 Mason St
- 14 Downing St
- 70 Jencks St
- 131 Thomas St
- 229 Concord St
- 153 Jencks St
- 166 Stonehaven Rd
- 219 Earle St Unit 3
- 47 Boutwell St
- 178 County St
- 6 N Rocliffe St
- 182 Quequechan St
- 127 Middlesex St
Ask me questions while you tour the home.