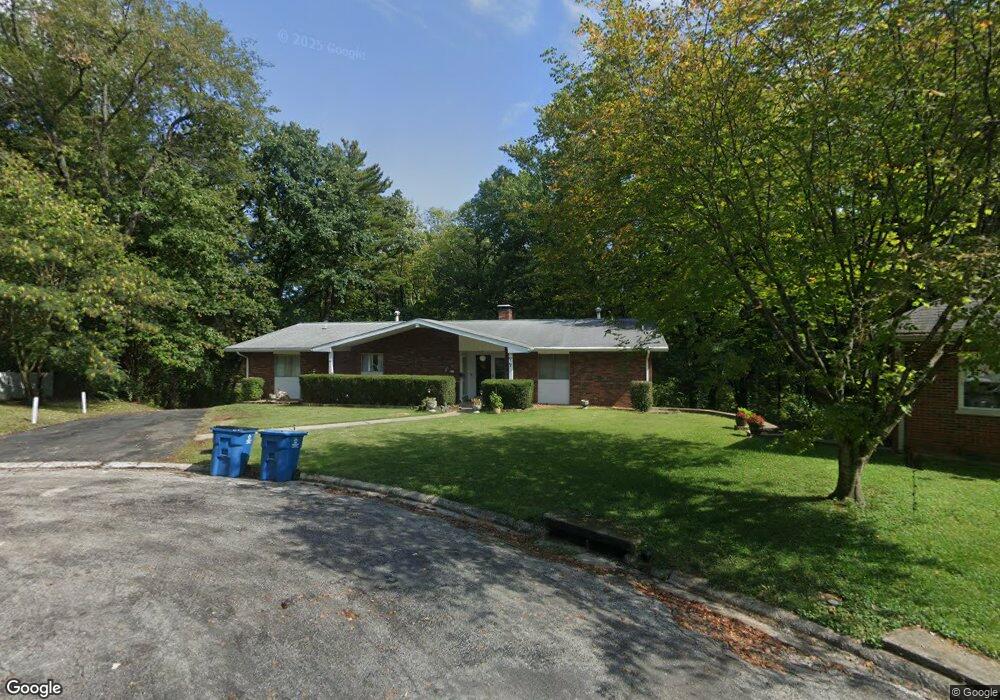
23 Meta Dr Swansea, IL 62226
Estimated Value: $232,000 - $259,819
--
Bed
--
Bath
2,466
Sq Ft
$99/Sq Ft
Est. Value
About This Home
This home is located at 23 Meta Dr, Swansea, IL 62226 and is currently estimated at $243,955, approximately $98 per square foot. 23 Meta Dr is a home with nearby schools including High Mount Elementary School and Governor French Academy.
Ownership History
Date
Name
Owned For
Owner Type
Purchase Details
Closed on
Dec 13, 2018
Sold by
Rosciglione James and Rosciglione Sandra Kay
Bought by
Wilson Jefferie M and Kane Kelli M
Current Estimated Value
Home Financials for this Owner
Home Financials are based on the most recent Mortgage that was taken out on this home.
Original Mortgage
$143,355
Outstanding Balance
$126,299
Interest Rate
4.8%
Mortgage Type
FHA
Estimated Equity
$117,656
Purchase Details
Closed on
Apr 1, 1998
Bought by
Rosciglione James and Rosciglione Sandra K
Create a Home Valuation Report for This Property
The Home Valuation Report is an in-depth analysis detailing your home's value as well as a comparison with similar homes in the area
Home Values in the Area
Average Home Value in this Area
Purchase History
| Date | Buyer | Sale Price | Title Company |
|---|---|---|---|
| Wilson Jefferie M | $146,000 | Community Title Shiloh Llc | |
| Rosciglione James | $100,000 | -- |
Source: Public Records
Mortgage History
| Date | Status | Borrower | Loan Amount |
|---|---|---|---|
| Open | Wilson Jefferie M | $143,355 |
Source: Public Records
Tax History Compared to Growth
Tax History
| Year | Tax Paid | Tax Assessment Tax Assessment Total Assessment is a certain percentage of the fair market value that is determined by local assessors to be the total taxable value of land and additions on the property. | Land | Improvement |
|---|---|---|---|---|
| 2024 | $6,521 | $79,107 | $12,108 | $66,999 |
| 2023 | $6,206 | $72,573 | $11,941 | $60,632 |
| 2022 | $5,857 | $66,095 | $10,875 | $55,220 |
| 2021 | $5,751 | $63,383 | $10,429 | $52,954 |
| 2020 | $5,546 | $59,027 | $9,712 | $49,315 |
| 2019 | $4,901 | $53,752 | $10,605 | $43,147 |
| 2018 | $4,342 | $52,379 | $10,334 | $42,045 |
| 2017 | $2,121 | $50,985 | $10,059 | $40,926 |
| 2016 | $4,217 | $49,227 | $9,712 | $39,515 |
| 2014 | $1,812 | $49,186 | $7,450 | $41,736 |
| 2013 | $3,482 | $49,186 | $7,450 | $41,736 |
Source: Public Records
Map
Nearby Homes