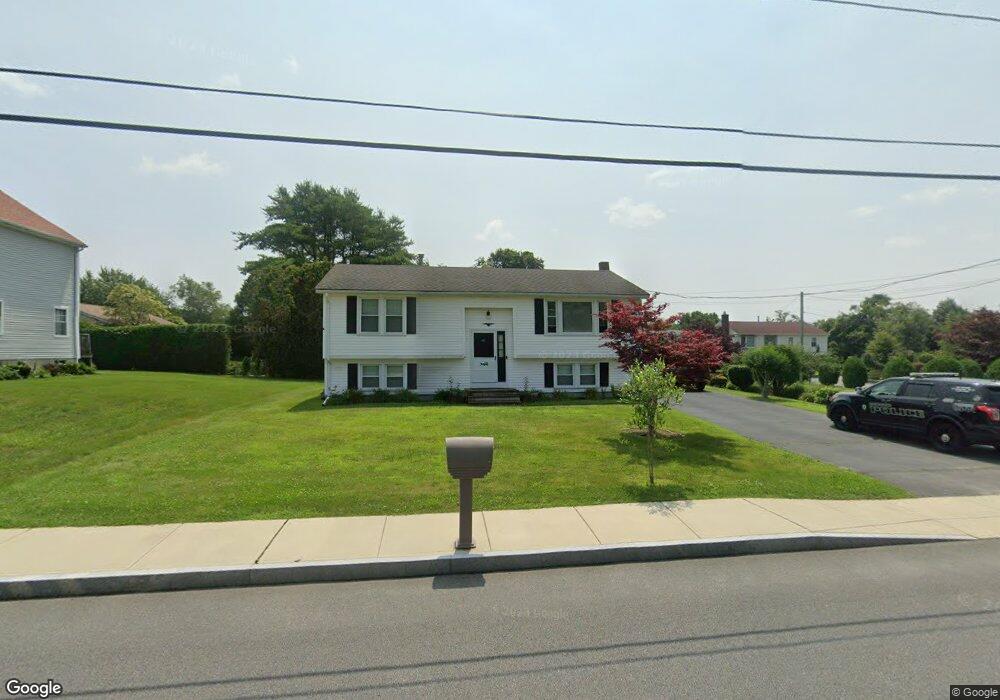
23 Milton St South Dartmouth, MA 02748
Bliss Corner NeighborhoodEstimated Value: $429,000 - $508,000
3
Beds
2
Baths
1,040
Sq Ft
$437/Sq Ft
Est. Value
About This Home
This home is located at 23 Milton St, South Dartmouth, MA 02748 and is currently estimated at $454,865, approximately $437 per square foot. 23 Milton St is a home located in Bristol County with nearby schools including Dartmouth High School, Our Sister's School, and Bishop Stang High School.
Ownership History
Date
Name
Owned For
Owner Type
Purchase Details
Closed on
Nov 30, 2000
Sold by
Borges Tavar Mary and Tavares Mary Lou
Bought by
Tavares Eugenio M and Tavares Grace
Current Estimated Value
Purchase Details
Closed on
Oct 21, 1991
Sold by
Mendes George and Mendes Mary L
Bought by
Borges Mary Lou
Create a Home Valuation Report for This Property
The Home Valuation Report is an in-depth analysis detailing your home's value as well as a comparison with similar homes in the area
Home Values in the Area
Average Home Value in this Area
Purchase History
| Date | Buyer | Sale Price | Title Company |
|---|---|---|---|
| Tavares Eugenio M | $140,000 | -- | |
| Borges Mary Lou | $115,000 | -- |
Source: Public Records
Mortgage History
| Date | Status | Borrower | Loan Amount |
|---|---|---|---|
| Open | Borges Mary Lou | $25,000 | |
| Open | Borges Mary Lou | $175,000 | |
| Closed | Borges Mary Lou | $125,000 |
Source: Public Records
Tax History Compared to Growth
Tax History
| Year | Tax Paid | Tax Assessment Tax Assessment Total Assessment is a certain percentage of the fair market value that is determined by local assessors to be the total taxable value of land and additions on the property. | Land | Improvement |
|---|---|---|---|---|
| 2025 | $3,066 | $356,100 | $134,100 | $222,000 |
| 2024 | $2,988 | $343,800 | $134,100 | $209,700 |
| 2023 | $2,912 | $317,600 | $134,100 | $183,500 |
| 2022 | $2,949 | $297,900 | $134,100 | $163,800 |
| 2021 | $2,991 | $288,700 | $130,200 | $158,500 |
| 2020 | $2,908 | $280,200 | $128,900 | $151,300 |
| 2019 | $2,768 | $266,200 | $123,700 | $142,500 |
| 2018 | $2,545 | $254,200 | $126,300 | $127,900 |
| 2017 | $2,467 | $246,200 | $116,700 | $129,500 |
| 2016 | $2,282 | $224,600 | $103,200 | $121,400 |
| 2015 | $2,224 | $219,300 | $96,400 | $122,900 |
| 2014 | $2,185 | $214,000 | $93,900 | $120,100 |
Source: Public Records
Map
Nearby Homes
- 6 Jacob Dr
- 33 Rosewood Terrace
- 212 Rockland St
- 5 Samosett Dr
- 3 Mishawum Dr
- 29 Elizabeth Ct
- 98 Mccabe St
- 6 Walters Way
- 179 Rockland St
- 21 Avis St
- 25 Westwood Dr
- 360 Russells Mills Rd
- 48 Wilson St
- 76 Shipyard Ln
- 15 Puritan St
- 32 Fulton St
- 1 Walter St
- 75 Country Way Unit 75
- 0 Victoria St Unit 73457953
- 49 Stackhouse St