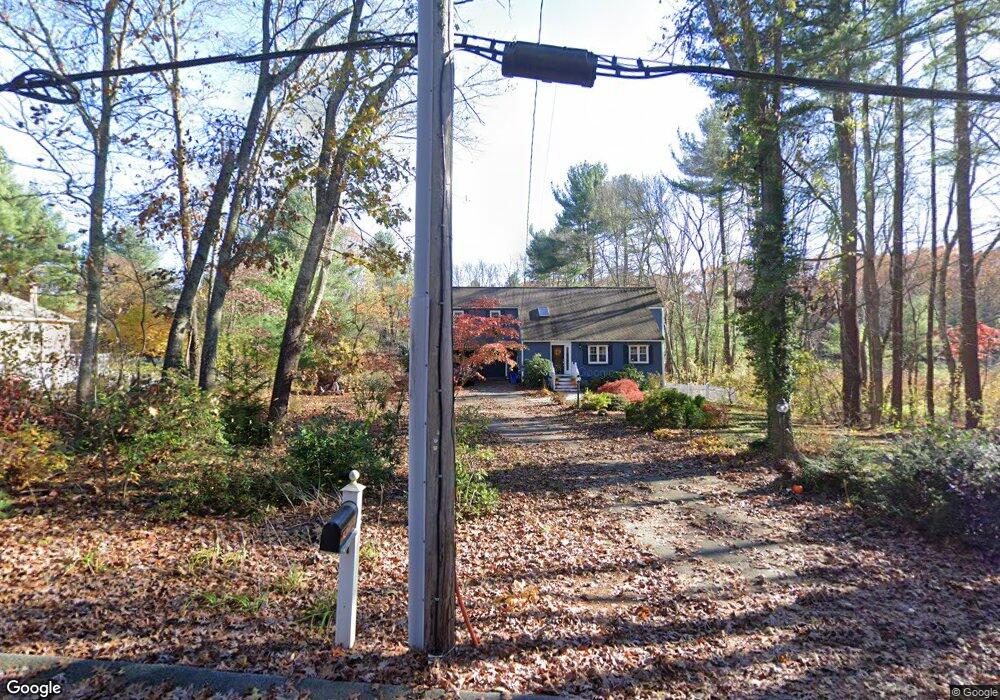
23 Moore Rd Sudbury, MA 01776
Estimated Value: $1,008,000 - $1,204,000
3
Beds
4
Baths
2,530
Sq Ft
$442/Sq Ft
Est. Value
About This Home
This home is located at 23 Moore Rd, Sudbury, MA 01776 and is currently estimated at $1,118,302, approximately $442 per square foot. 23 Moore Rd is a home located in Middlesex County with nearby schools including Peter Noyes Elementary School, Ephraim Curtis Middle School, and Lincoln-Sudbury Regional High School.
Ownership History
Date
Name
Owned For
Owner Type
Purchase Details
Closed on
Jan 24, 2025
Sold by
Perry Joel A and Perry Heather C
Bought by
Jh Perry Lt and Perry
Current Estimated Value
Purchase Details
Closed on
May 30, 2014
Sold by
Casale Anthony M and Casale Denise A
Bought by
Perry Joel A and Perry Heather C
Home Financials for this Owner
Home Financials are based on the most recent Mortgage that was taken out on this home.
Original Mortgage
$537,200
Interest Rate
4.26%
Mortgage Type
Purchase Money Mortgage
Purchase Details
Closed on
Mar 15, 2004
Sold by
Williams Miriam I and Bullard Bonnie M
Bought by
Casale Anthony M and Casale Denise A
Home Financials for this Owner
Home Financials are based on the most recent Mortgage that was taken out on this home.
Original Mortgage
$210,000
Interest Rate
5.67%
Mortgage Type
Purchase Money Mortgage
Create a Home Valuation Report for This Property
The Home Valuation Report is an in-depth analysis detailing your home's value as well as a comparison with similar homes in the area
Home Values in the Area
Average Home Value in this Area
Purchase History
| Date | Buyer | Sale Price | Title Company |
|---|---|---|---|
| Jh Perry Lt | -- | None Available | |
| Perry Joel A | $632,000 | -- | |
| Casale Anthony M | $522,000 | -- | |
| Casale Anthony M | $522,000 | -- |
Source: Public Records
Mortgage History
| Date | Status | Borrower | Loan Amount |
|---|---|---|---|
| Previous Owner | Perry Joel A | $537,200 | |
| Previous Owner | Casale Anthony M | $300,000 | |
| Previous Owner | Casale Anthony M | $210,000 |
Source: Public Records
Tax History
| Year | Tax Paid | Tax Assessment Tax Assessment Total Assessment is a certain percentage of the fair market value that is determined by local assessors to be the total taxable value of land and additions on the property. | Land | Improvement |
|---|---|---|---|---|
| 2025 | $15,205 | $1,038,600 | $373,200 | $665,400 |
| 2024 | $14,649 | $1,002,700 | $362,300 | $640,400 |
| 2023 | $13,603 | $862,600 | $335,400 | $527,200 |
| 2022 | $13,155 | $728,800 | $307,900 | $420,900 |
| 2021 | $12,580 | $668,100 | $307,900 | $360,200 |
| 2020 | $12,326 | $668,100 | $307,900 | $360,200 |
| 2019 | $11,966 | $668,100 | $307,900 | $360,200 |
| 2018 | $11,692 | $652,100 | $328,300 | $323,800 |
| 2017 | $10,745 | $605,700 | $312,300 | $293,400 |
| 2016 | $10,299 | $578,600 | $300,400 | $278,200 |
| 2015 | $10,227 | $581,100 | $305,800 | $275,300 |
| 2014 | $10,210 | $566,300 | $296,800 | $269,500 |
Source: Public Records
Map
Nearby Homes
- 557 Dutton Rd Unit 2
- 15 Harness Ln
- 30 Harness Ln
- 11 Great Lake Dr
- 53 Pine St
- 11 October Rd
- 45 Webster Cir
- 30 Kendall Rd
- 62 Churchill St
- 22 Barracks Rd Unit 22
- 55 Widow Rites Ln
- 45 Widow Rites Ln
- 30 Rolling Ln
- 15 Huckleberry Ln
- 111 Willis Rd
- 788 Main St
- 786 Main St
- 0 Robbins Rd
- 8 Shoreline Dr Unit 11
- 5 Shore Line Rd
Your Personal Tour Guide
Ask me questions while you tour the home.