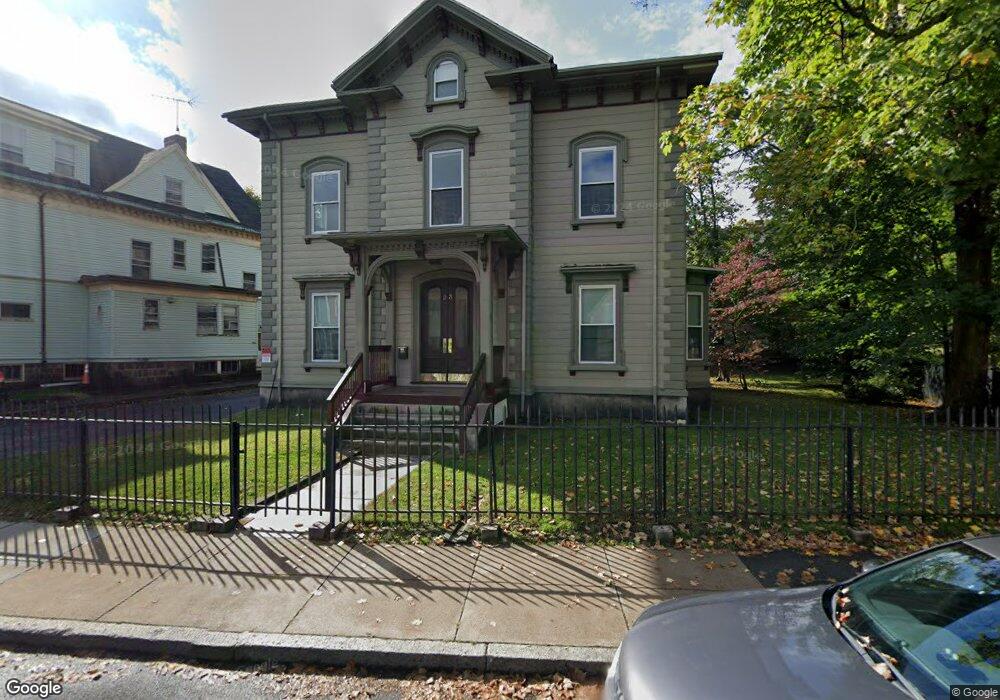
23 Moreland St Roxbury, MA 02119
Sav-Mor NeighborhoodEstimated Value: $973,000 - $1,236,799
8
Beds
4
Baths
4,221
Sq Ft
$267/Sq Ft
Est. Value
About This Home
This home is located at 23 Moreland St, Roxbury, MA 02119 and is currently estimated at $1,128,200, approximately $267 per square foot. 23 Moreland St is a home located in Suffolk County with nearby schools including Dudley Street Neighborhood Charter School and City on a Hill Charter Public School.
Ownership History
Date
Name
Owned For
Owner Type
Purchase Details
Closed on
Oct 21, 2014
Sold by
Annett Patricia
Bought by
Samh Corp
Current Estimated Value
Purchase Details
Closed on
May 6, 1987
Sold by
Morris John
Bought by
Annett Patricia J
Create a Home Valuation Report for This Property
The Home Valuation Report is an in-depth analysis detailing your home's value as well as a comparison with similar homes in the area
Home Values in the Area
Average Home Value in this Area
Purchase History
| Date | Buyer | Sale Price | Title Company |
|---|---|---|---|
| Samh Corp | $412,500 | -- | |
| Annett Patricia J | $160,000 | -- |
Source: Public Records
Mortgage History
| Date | Status | Borrower | Loan Amount |
|---|---|---|---|
| Previous Owner | Annett Patricia J | $100,000 | |
| Previous Owner | Annett Patricia J | $21,000 | |
| Previous Owner | Annett Patricia J | $7,500 | |
| Previous Owner | Annett Patricia J | $50,000 |
Source: Public Records
Tax History Compared to Growth
Tax History
| Year | Tax Paid | Tax Assessment Tax Assessment Total Assessment is a certain percentage of the fair market value that is determined by local assessors to be the total taxable value of land and additions on the property. | Land | Improvement |
|---|---|---|---|---|
| 2025 | $11,653 | $1,006,300 | $386,700 | $619,600 |
| 2024 | $10,212 | $936,900 | $328,000 | $608,900 |
| 2023 | $9,406 | $875,800 | $306,600 | $569,200 |
| 2022 | $8,662 | $796,100 | $278,700 | $517,400 |
| 2021 | $7,866 | $737,200 | $258,100 | $479,100 |
| 2020 | $6,747 | $638,900 | $251,700 | $387,200 |
| 2019 | $6,299 | $597,600 | $199,800 | $397,800 |
| 2018 | $5,796 | $553,100 | $199,800 | $353,300 |
| 2017 | $5,857 | $553,100 | $199,800 | $353,300 |
| 2016 | $4,616 | $419,594 | $163,836 | $255,758 |
| 2015 | $4,832 | $399,000 | $132,100 | $266,900 |
| 2014 | $4,564 | $362,800 | $132,100 | $230,700 |
Source: Public Records
Map
Nearby Homes
- 20 Rockville Park
- 22 Rockville Park
- 37 Regent St Unit 2
- 30 Copeland St Unit 1
- 33 Copeland Park Unit C
- 10 Rockland St Unit 4
- 7 Langford Park Unit 3
- 101 Mount Pleasant Ave
- 51 Saint James St
- 59 Perrin St
- 59 Perrin St Unit 1
- 108 Mount Pleasant Ave Unit 108R
- 94 Walnut Ave
- 2 Mount Pleasant Place Unit 2
- 91 Zeigler St
- 250 Dudley St Unit 1
- 22 Alaska St
- 80 Blue Hill Ave Unit 5
- 119 Blue Hill Ave
- 31 Alaska St
- 23 Moreland St Unit 2B
- 23 Moreland St Unit 2
- 23 Moreland St Unit 1
- 25 Moreland St
- 14 Rockville Park
- 27 Moreland St
- 16 Rockville Park
- 12 Rockville Park
- 22 Moreland St Unit 3
- 22 Moreland St Unit 1
- 22 Moreland St Unit 2
- 22 Moreland St
- 10 Rockville Park
- 10 Rockville Park
- 10 Rockville Park Unit 2
- 16A Rockville Park
- 24 Moreland St Unit 26
- 20 Moreland St Unit 1
- 20 Moreland St Unit 2
- 18 Moreland St Unit 20