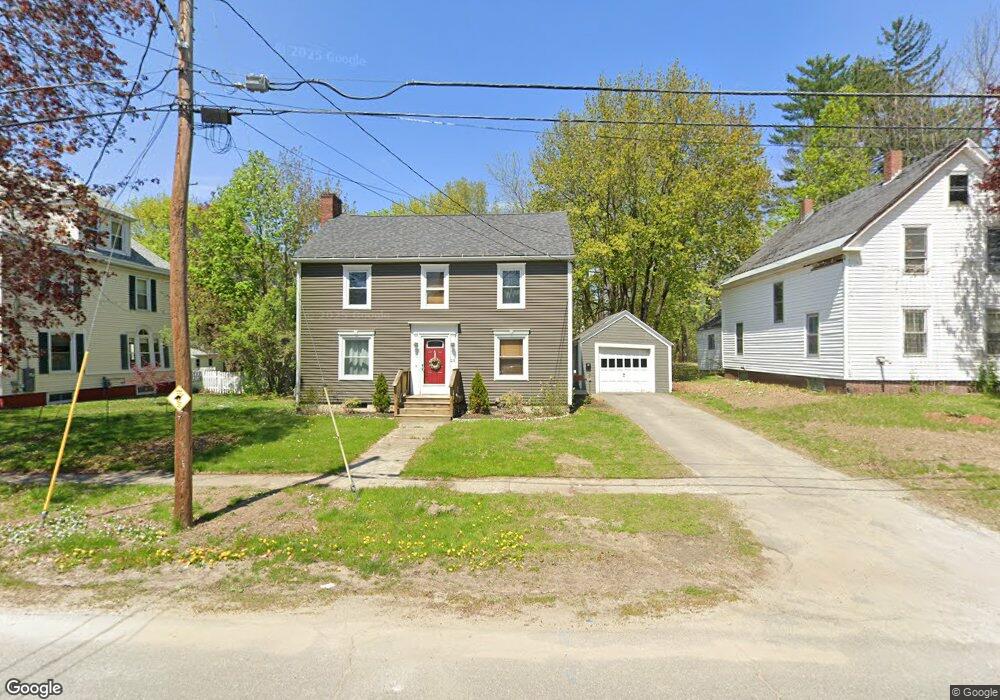
23 Morrill Ave Waterville, ME 04901
Estimated Value: $305,000 - $318,000
3
Beds
2
Baths
1,730
Sq Ft
$181/Sq Ft
Est. Value
About This Home
This home is located at 23 Morrill Ave, Waterville, ME 04901 and is currently estimated at $312,620, approximately $180 per square foot. 23 Morrill Ave is a home located in Kennebec County with nearby schools including George J. Mitchell School, Albert S. Hall School, and Waterville Junior High School.
Ownership History
Date
Name
Owned For
Owner Type
Purchase Details
Closed on
Oct 25, 2019
Sold by
Smith Margaret K and Smith Tyler M
Bought by
Smith Margaret K
Current Estimated Value
Home Financials for this Owner
Home Financials are based on the most recent Mortgage that was taken out on this home.
Original Mortgage
$103,000
Interest Rate
3.6%
Mortgage Type
New Conventional
Purchase Details
Closed on
Jun 27, 2008
Sold by
Beal Mary A
Bought by
Smith Margaret K and Smith Tyler K
Home Financials for this Owner
Home Financials are based on the most recent Mortgage that was taken out on this home.
Original Mortgage
$115,192
Interest Rate
6.07%
Mortgage Type
FHA
Create a Home Valuation Report for This Property
The Home Valuation Report is an in-depth analysis detailing your home's value as well as a comparison with similar homes in the area
Home Values in the Area
Average Home Value in this Area
Purchase History
| Date | Buyer | Sale Price | Title Company |
|---|---|---|---|
| Smith Margaret K | -- | None Available | |
| Smith Margaret K | -- | -- |
Source: Public Records
Mortgage History
| Date | Status | Borrower | Loan Amount |
|---|---|---|---|
| Previous Owner | Smith Margaret K | $103,000 | |
| Previous Owner | Smith Margaret K | $115,192 |
Source: Public Records
Tax History
| Year | Tax Paid | Tax Assessment Tax Assessment Total Assessment is a certain percentage of the fair market value that is determined by local assessors to be the total taxable value of land and additions on the property. | Land | Improvement |
|---|---|---|---|---|
| 2025 | $4,381 | $257,700 | $30,100 | $227,600 |
| 2024 | $4,558 | $227,900 | $23,200 | $204,700 |
| 2023 | $4,535 | $227,900 | $23,200 | $204,700 |
| 2022 | $3,684 | $142,500 | $17,400 | $125,100 |
| 2021 | $3,634 | $142,500 | $17,400 | $125,100 |
| 2020 | $3,040 | $142,500 | $17,400 | $125,100 |
| 2019 | $3,671 | $142,500 | $17,400 | $125,100 |
| 2018 | $3,601 | $142,500 | $17,400 | $125,100 |
| 2017 | $3,325 | $142,500 | $17,400 | $125,100 |
| 2016 | $3,249 | $142,500 | $17,400 | $125,100 |
| 2015 | $2,938 | $105,700 | $19,100 | $86,600 |
| 2014 | $2,896 | $105,700 | $19,100 | $86,600 |
| 2013 | $2,896 | $105,700 | $19,100 | $86,600 |
Source: Public Records
Map
Nearby Homes
Your Personal Tour Guide
Ask me questions while you tour the home.