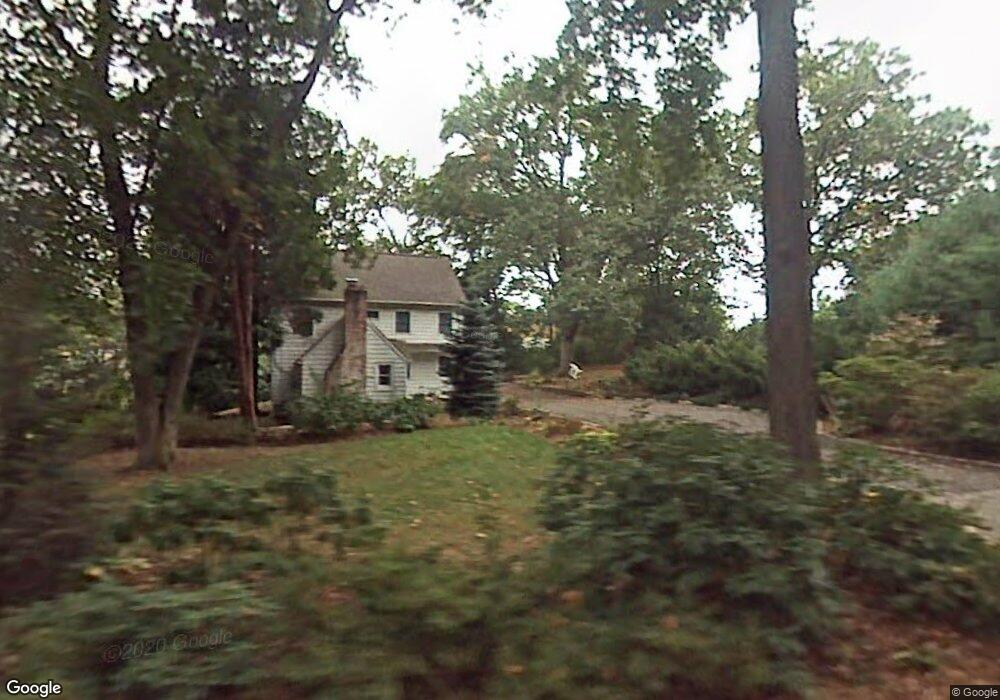
23 N Brae Ct Tenafly, NJ 07670
Estimated Value: $2,704,000 - $3,928,000
Studio
--
Bath
5,658
Sq Ft
$573/Sq Ft
Est. Value
About This Home
This home is located at 23 N Brae Ct, Tenafly, NJ 07670 and is currently estimated at $3,239,210, approximately $572 per square foot. 23 N Brae Ct is a home located in Bergen County with nearby schools including Tenafly Middle School, Tenafly High School, and Spring School.
Ownership History
Date
Name
Owned For
Owner Type
Purchase Details
Closed on
May 9, 2014
Sold by
23N Brae Llc
Bought by
Pimenta De Madeiros Ricardo and Merklen Alejandra
Current Estimated Value
Home Financials for this Owner
Home Financials are based on the most recent Mortgage that was taken out on this home.
Original Mortgage
$1,300,000
Outstanding Balance
$923,653
Interest Rate
2.62%
Mortgage Type
New Conventional
Estimated Equity
$2,315,557
Purchase Details
Closed on
Jul 19, 2013
Sold by
Alexe Remus and Allen Robb
Bought by
23 N Brae Llc
Purchase Details
Closed on
Jan 22, 2013
Sold by
Mcintyre John W and Mcintyre Colleen R
Bought by
Alexe Remus and Allen Robb
Create a Home Valuation Report for This Property
The Home Valuation Report is an in-depth analysis detailing your home's value as well as a comparison with similar homes in the area
Home Values in the Area
Average Home Value in this Area
Purchase History
| Date | Buyer | Sale Price | Title Company |
|---|---|---|---|
| Pimenta De Madeiros Ricardo | $2,800,000 | -- | |
| 23 N Brae Llc | $565,488 | -- | |
| Alexe Remus | $950,000 | -- |
Source: Public Records
Mortgage History
| Date | Status | Borrower | Loan Amount |
|---|---|---|---|
| Open | Pimenta De Madeiros Ricardo | $1,300,000 |
Source: Public Records
Tax History
| Year | Tax Paid | Tax Assessment Tax Assessment Total Assessment is a certain percentage of the fair market value that is determined by local assessors to be the total taxable value of land and additions on the property. | Land | Improvement |
|---|---|---|---|---|
| 2025 | $71,025 | $2,500,000 | $822,000 | $1,678,000 |
| 2024 | $69,300 | $2,500,000 | $822,000 | $1,678,000 |
| 2023 | $67,625 | $2,500,000 | $822,000 | $1,678,000 |
| 2022 | $67,625 | $2,500,000 | $822,000 | $1,678,000 |
| 2021 | $68,524 | $2,579,000 | $822,000 | $1,757,000 |
| 2020 | $67,518 | $2,579,000 | $822,000 | $1,757,000 |
| 2019 | $66,332 | $2,579,000 | $822,000 | $1,757,000 |
| 2018 | $65,300 | $2,579,000 | $822,000 | $1,757,000 |
| 2017 | $65,068 | $2,579,000 | $822,000 | $1,757,000 |
| 2016 | $63,598 | $2,571,700 | $822,000 | $1,749,700 |
| 2015 | $62,184 | $2,571,700 | $822,000 | $1,749,700 |
| 2014 | $61,026 | $822,000 | $822,000 | $0 |
Source: Public Records
Map
Nearby Homes
Your Personal Tour Guide
Ask me questions while you tour the home.