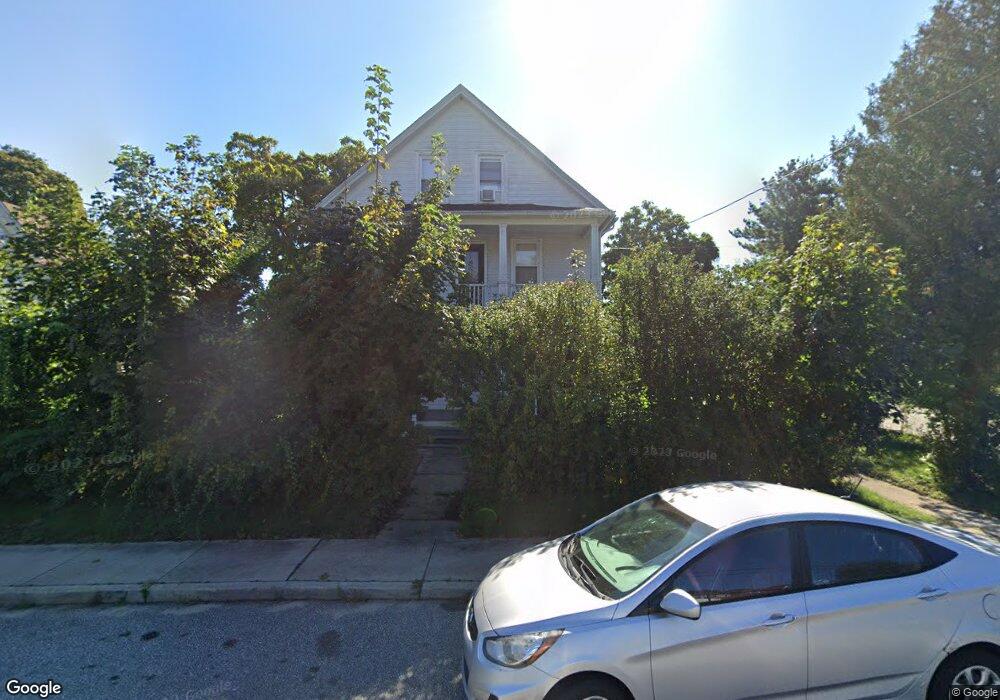
23 Natchaug St Willimantic, CT 06226
Estimated Value: $265,942 - $358,000
7
Beds
2
Baths
2,567
Sq Ft
$121/Sq Ft
Est. Value
About This Home
This home is located at 23 Natchaug St, Willimantic, CT 06226 and is currently estimated at $310,736, approximately $121 per square foot. 23 Natchaug St is a home located in Windham County with nearby schools including Windham Middle School and Windham High School.
Ownership History
Date
Name
Owned For
Owner Type
Purchase Details
Closed on
Feb 12, 2007
Sold by
Rodriguez Kenneth B and Vega Xiomara L
Bought by
Gonzales Elpidio
Current Estimated Value
Home Financials for this Owner
Home Financials are based on the most recent Mortgage that was taken out on this home.
Original Mortgage
$223,200
Outstanding Balance
$134,133
Interest Rate
6.22%
Mortgage Type
Purchase Money Mortgage
Estimated Equity
$176,603
Purchase Details
Closed on
Apr 19, 2001
Sold by
Department Of Housing & Urban Dev
Bought by
Rodriguez Kenneth and Vega Xiomara
Home Financials for this Owner
Home Financials are based on the most recent Mortgage that was taken out on this home.
Original Mortgage
$61,220
Interest Rate
11%
Mortgage Type
Purchase Money Mortgage
Purchase Details
Closed on
Jan 15, 1991
Sold by
Burelle Beverly
Bought by
Lopez Benjamin
Create a Home Valuation Report for This Property
The Home Valuation Report is an in-depth analysis detailing your home's value as well as a comparison with similar homes in the area
Home Values in the Area
Average Home Value in this Area
Purchase History
| Date | Buyer | Sale Price | Title Company |
|---|---|---|---|
| Gonzales Elpidio | $248,000 | -- | |
| Gonzales Elpidio | $248,000 | -- | |
| Rodriguez Kenneth | $68,000 | -- | |
| Rodriguez Kenneth | $68,000 | -- | |
| Lopez Benjamin | $123,000 | -- | |
| Lopez Benjamin | $123,000 | -- |
Source: Public Records
Mortgage History
| Date | Status | Borrower | Loan Amount |
|---|---|---|---|
| Open | Lopez Benjamin | $223,200 | |
| Closed | Lopez Benjamin | $223,200 | |
| Previous Owner | Lopez Benjamin | $61,220 |
Source: Public Records
Tax History
| Year | Tax Paid | Tax Assessment Tax Assessment Total Assessment is a certain percentage of the fair market value that is determined by local assessors to be the total taxable value of land and additions on the property. | Land | Improvement |
|---|---|---|---|---|
| 2025 | $6,124 | $165,420 | $27,370 | $138,050 |
| 2024 | $6,130 | $165,420 | $27,370 | $138,050 |
| 2023 | $4,284 | $90,390 | $23,800 | $66,590 |
| 2022 | $4,221 | $90,390 | $23,800 | $66,590 |
| 2021 | $4,528 | $90,390 | $23,800 | $66,590 |
| 2020 | $4,518 | $90,390 | $23,800 | $66,590 |
| 2019 | $4,444 | $90,390 | $23,800 | $66,590 |
| 2017 | $4,387 | $92,150 | $19,540 | $72,610 |
| 2015 | $4,237 | $92,150 | $19,540 | $72,610 |
| 2014 | $4,002 | $92,150 | $19,540 | $72,610 |
Source: Public Records
Map
Nearby Homes
Your Personal Tour Guide
Ask me questions while you tour the home.