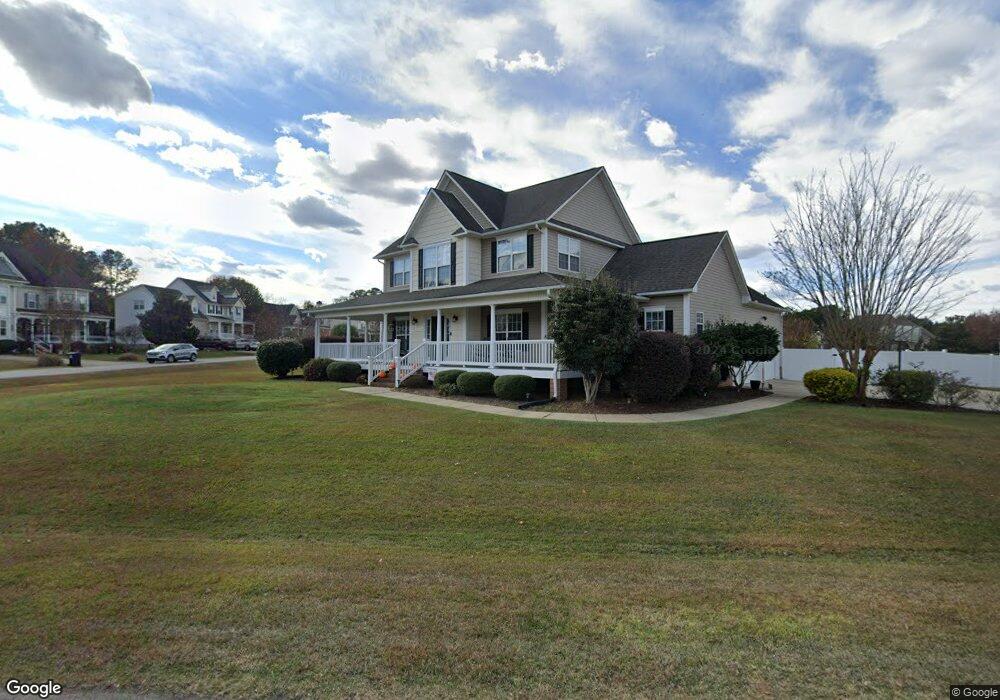
23 Neuse Landing Dr Clayton, NC 27527
Estimated Value: $447,000 - $496,000
3
Beds
3
Baths
2,388
Sq Ft
$196/Sq Ft
Est. Value
About This Home
This home is located at 23 Neuse Landing Dr, Clayton, NC 27527 and is currently estimated at $468,775, approximately $196 per square foot. 23 Neuse Landing Dr is a home located in Johnston County with nearby schools including Powhatan Elementary School, Riverwood Middle School, and Clayton High.
Ownership History
Date
Name
Owned For
Owner Type
Purchase Details
Closed on
Sep 22, 2020
Sold by
Barefoot Daphne C and Barefoot Stacey M
Bought by
Jackson Daniel Lee and Jackson Michelle D
Current Estimated Value
Home Financials for this Owner
Home Financials are based on the most recent Mortgage that was taken out on this home.
Original Mortgage
$226,400
Outstanding Balance
$200,915
Interest Rate
2.9%
Mortgage Type
New Conventional
Estimated Equity
$267,860
Purchase Details
Closed on
Nov 28, 2007
Sold by
Gidco Inc
Bought by
Barefoot Daphne C and Roberts Stacey M
Home Financials for this Owner
Home Financials are based on the most recent Mortgage that was taken out on this home.
Original Mortgage
$221,600
Interest Rate
6.22%
Mortgage Type
Purchase Money Mortgage
Purchase Details
Closed on
Nov 6, 2006
Sold by
Jdg Investments Inc
Bought by
Gidco Inc
Create a Home Valuation Report for This Property
The Home Valuation Report is an in-depth analysis detailing your home's value as well as a comparison with similar homes in the area
Home Values in the Area
Average Home Value in this Area
Purchase History
| Date | Buyer | Sale Price | Title Company |
|---|---|---|---|
| Jackson Daniel Lee | $295,000 | None Available | |
| Barefoot Daphne C | $272,000 | None Available | |
| Gidco Inc | $169,000 | None Available |
Source: Public Records
Mortgage History
| Date | Status | Borrower | Loan Amount |
|---|---|---|---|
| Open | Jackson Daniel Lee | $226,400 | |
| Previous Owner | Barefoot Daphne C | $221,600 |
Source: Public Records
Tax History Compared to Growth
Tax History
| Year | Tax Paid | Tax Assessment Tax Assessment Total Assessment is a certain percentage of the fair market value that is determined by local assessors to be the total taxable value of land and additions on the property. | Land | Improvement |
|---|---|---|---|---|
| 2025 | $3,003 | $472,920 | $65,000 | $407,920 |
| 2024 | $2,553 | $315,160 | $45,000 | $270,160 |
| 2023 | $2,427 | $315,160 | $45,000 | $270,160 |
| 2022 | $2,490 | $315,160 | $45,000 | $270,160 |
| 2021 | $2,490 | $315,160 | $45,000 | $270,160 |
| 2020 | $2,590 | $315,160 | $45,000 | $270,160 |
| 2019 | $2,591 | $315,160 | $45,000 | $270,160 |
| 2018 | $2,226 | $264,100 | $40,000 | $224,100 |
| 2017 | $2,227 | $264,100 | $40,000 | $224,100 |
| 2016 | $2,218 | $264,100 | $40,000 | $224,100 |
| 2015 | $2,218 | $264,100 | $40,000 | $224,100 |
| 2014 | $2,218 | $264,100 | $40,000 | $224,100 |
Source: Public Records
Map
Nearby Homes
- 319 River Knoll Dr
- 505 Vinson Rd
- 138 Claymore Dr
- 86 Sharpstone Ln
- 81 Northcliff Ct
- 118 Christian St
- 630 Southerland Rd
- 30 Neuse Hollow Ct
- 532 Southerland Rd
- 66 Neuse Hollow Ct
- 102 Neuse Hollow Ct
- 49 Neuse Hollow Ct
- 90 Neuse Hollow Ct
- 371 Neuse Hollow Ct
- 18 Neuse Hollow Ct
- 387 Cascade Knoll Dr
- 119 Neuse Hollow Ct
- Blanco Plan at Neuse Ridge
- Palmer Plan at Neuse Ridge
- Durham Plan at Neuse Ridge
- Lot 9 Neuse Haven Estates
- 111 River Knoll Dr
- 45 Neuse Landing Dr
- 16 Neuse Landing Dr
- 34 Neuse Landing Dr
- 138 River Knoll Dr
- 120 River Knoll Dr
- 89 River Knoll Dr
- 154 River Knoll Dr
- 65 Neuse Landing Dr
- 65 Neuse Landing Dr Unit LT208
- 65 Neuse Landing Dr Unit L208
- 102 River Knoll Dr
- 56 Neuse Landing Dr
- 176 River Knoll Dr
- 197 River Knoll Dr
- 78 Neuse Landing Dr
- 84 River Knoll Dr
- 77 Neuse Landing Dr
- 192 River Knoll Dr