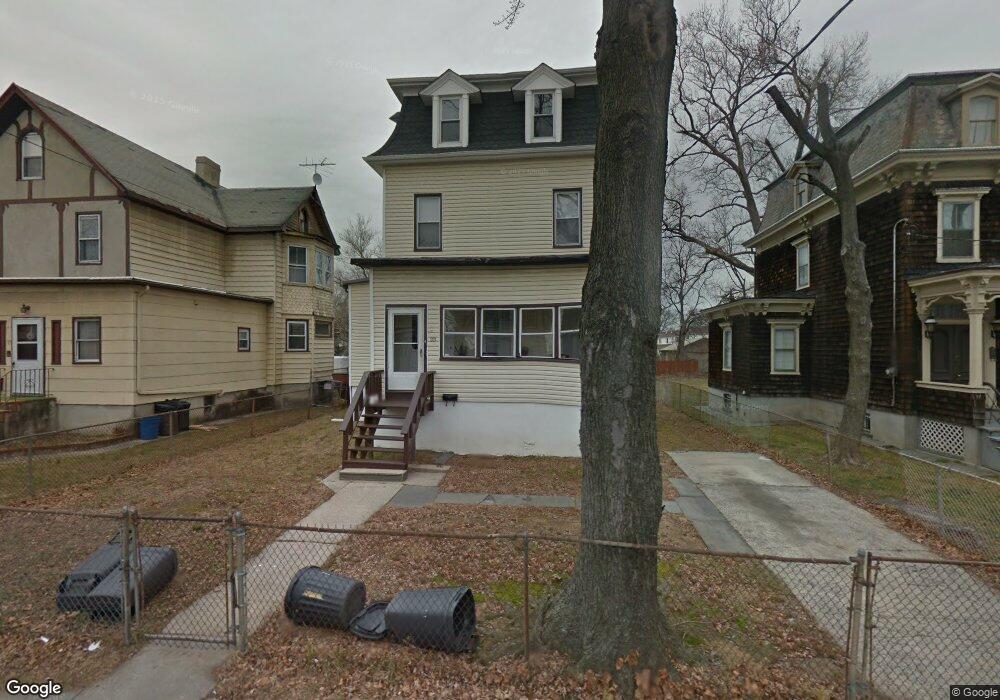
23 New St Staten Island, NY 10302
Port Richmond NeighborhoodEstimated Value: $567,000 - $672,000
5
Beds
2
Baths
2,608
Sq Ft
$243/Sq Ft
Est. Value
About This Home
This home is located at 23 New St, Staten Island, NY 10302 and is currently estimated at $633,302, approximately $242 per square foot. 23 New St is a home located in Richmond County with nearby schools including P.S. 20 Port Richmond, I.S. 51 Edwin Markham, and Susan E Wagner High School.
Ownership History
Date
Name
Owned For
Owner Type
Purchase Details
Closed on
Jan 16, 2019
Sold by
Albino Ramon A and Albino Lillian
Bought by
Canedo Gonzalo
Current Estimated Value
Purchase Details
Closed on
May 28, 2015
Sold by
Albino Ramon A
Bought by
Albino Ramon A and Albino Lillian
Purchase Details
Closed on
Oct 13, 2009
Sold by
Snow Guire and Steensen Guajardo Jasmine
Bought by
Albino Ramon A
Home Financials for this Owner
Home Financials are based on the most recent Mortgage that was taken out on this home.
Original Mortgage
$238,500
Interest Rate
5.09%
Mortgage Type
New Conventional
Create a Home Valuation Report for This Property
The Home Valuation Report is an in-depth analysis detailing your home's value as well as a comparison with similar homes in the area
Home Values in the Area
Average Home Value in this Area
Purchase History
| Date | Buyer | Sale Price | Title Company |
|---|---|---|---|
| Canedo Gonzalo | $330,000 | Fidelity National Title Ins | |
| Albino Ramon A | -- | None Available | |
| Albino Ramon A | $265,000 | Commonwealth Land Title Insu |
Source: Public Records
Mortgage History
| Date | Status | Borrower | Loan Amount |
|---|---|---|---|
| Previous Owner | Albino Ramon A | $238,500 |
Source: Public Records
Tax History Compared to Growth
Tax History
| Year | Tax Paid | Tax Assessment Tax Assessment Total Assessment is a certain percentage of the fair market value that is determined by local assessors to be the total taxable value of land and additions on the property. | Land | Improvement |
|---|---|---|---|---|
| 2025 | $4,985 | $37,800 | $6,556 | $31,244 |
| 2024 | $4,985 | $40,380 | $5,790 | $34,590 |
| 2023 | $4,755 | $23,414 | $4,755 | $18,659 |
| 2022 | $4,502 | $37,740 | $9,420 | $28,320 |
| 2021 | $4,746 | $34,020 | $9,420 | $24,600 |
| 2020 | $6,855 | $33,240 | $9,420 | $23,820 |
| 2019 | $4,327 | $29,580 | $9,420 | $20,160 |
| 2018 | $3,680 | $19,512 | $6,355 | $13,157 |
| 2017 | $3,531 | $18,792 | $8,039 | $10,753 |
| 2016 | $3,447 | $18,792 | $8,429 | $10,363 |
| 2015 | $3,003 | $18,269 | $6,265 | $12,004 |
| 2014 | $3,003 | $17,235 | $7,100 | $10,135 |
Source: Public Records
Map
Nearby Homes