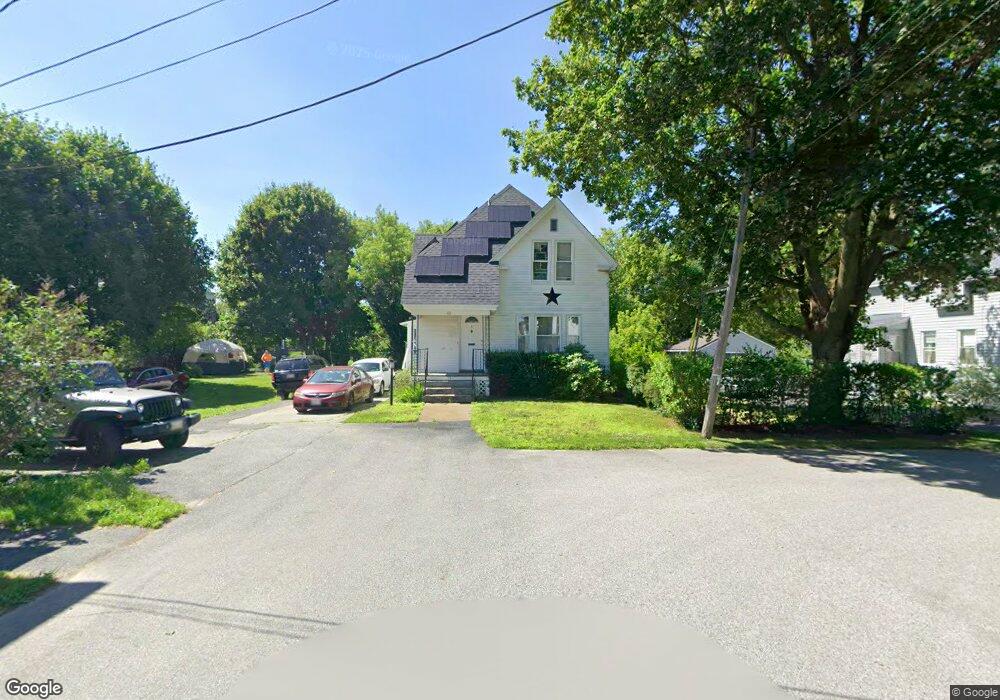
23 Newman St Lewiston, ME 04240
Estimated Value: $274,617 - $304,000
4
Beds
1
Bath
1,516
Sq Ft
$193/Sq Ft
Est. Value
About This Home
This home is located at 23 Newman St, Lewiston, ME 04240 and is currently estimated at $291,904, approximately $192 per square foot. 23 Newman St is a home located in Androscoggin County with nearby schools including Farwell Elementary School, Lewiston Middle School, and Lewiston High School.
Ownership History
Date
Name
Owned For
Owner Type
Purchase Details
Closed on
Aug 31, 2020
Sold by
Grenier Lucille B Est
Bought by
Grenier Gerard and Grenier Marcel
Current Estimated Value
Purchase Details
Closed on
Aug 20, 2020
Sold by
Grenier Marcel
Bought by
Grenier Gerard
Purchase Details
Closed on
Jun 24, 2011
Sold by
Peoples United Bank
Bought by
Grenier Gerard E and Grenier Lucille G
Create a Home Valuation Report for This Property
The Home Valuation Report is an in-depth analysis detailing your home's value as well as a comparison with similar homes in the area
Home Values in the Area
Average Home Value in this Area
Purchase History
| Date | Buyer | Sale Price | Title Company |
|---|---|---|---|
| Grenier Gerard | -- | None Available | |
| Grenier Gerard | -- | None Available | |
| Grenier Gerard E | -- | -- |
Source: Public Records
Tax History
| Year | Tax Paid | Tax Assessment Tax Assessment Total Assessment is a certain percentage of the fair market value that is determined by local assessors to be the total taxable value of land and additions on the property. | Land | Improvement |
|---|---|---|---|---|
| 2025 | $2,583 | $78,800 | $16,800 | $62,000 |
| 2024 | $2,503 | $78,800 | $16,800 | $62,000 |
| 2023 | $2,364 | $78,800 | $16,800 | $62,000 |
| 2022 | $2,246 | $78,800 | $16,800 | $62,000 |
| 2021 | $2,227 | $78,800 | $16,800 | $62,000 |
| 2020 | $2,259 | $78,800 | $16,800 | $62,000 |
| 2019 | $2,278 | $78,800 | $16,800 | $62,000 |
| 2018 | $2,259 | $78,800 | $16,800 | $62,000 |
| 2017 | $2,149 | $76,680 | $16,800 | $59,880 |
| 2016 | $2,112 | $76,680 | $16,800 | $59,880 |
| 2015 | $2,099 | $76,680 | $16,800 | $59,880 |
| 2014 | $2,039 | $76,680 | $16,800 | $59,880 |
| 2013 | $2,027 | $76,680 | $16,800 | $59,880 |
Source: Public Records
Map
Nearby Homes
Your Personal Tour Guide
Ask me questions while you tour the home.