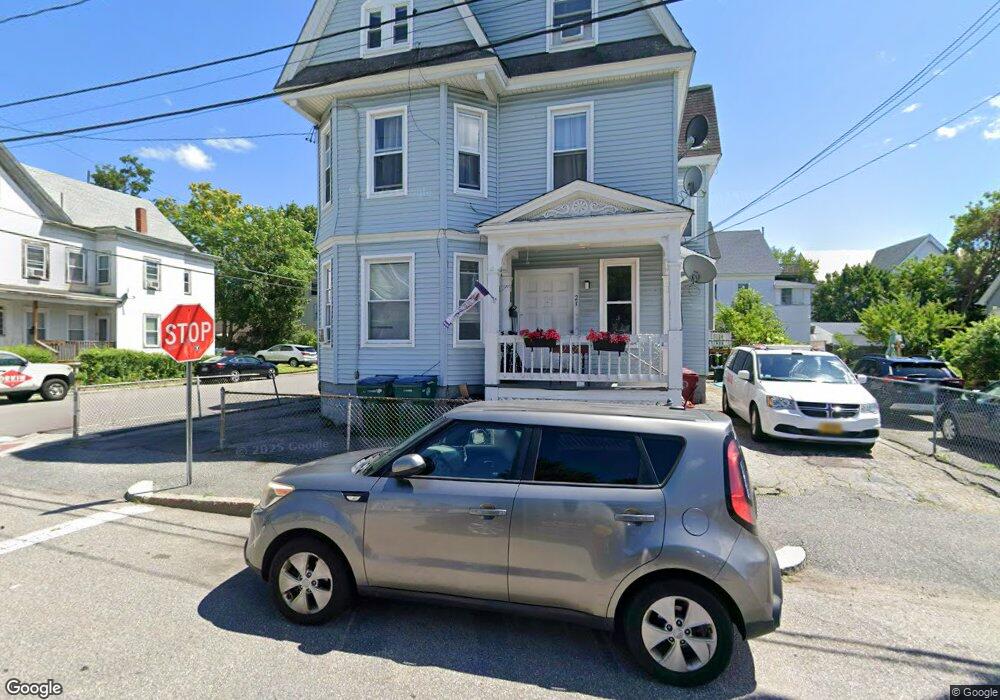
23 Oak St Lowell, MA 01852
Belvidere NeighborhoodEstimated Value: $440,092 - $735,000
6
Beds
3
Baths
3,382
Sq Ft
$191/Sq Ft
Est. Value
About This Home
This home is located at 23 Oak St, Lowell, MA 01852 and is currently estimated at $645,273, approximately $190 per square foot. 23 Oak St is a home located in Middlesex County with nearby schools including Moody Elementary School, Abraham Lincoln Elementary School, and Greenhalge Elementary School.
Ownership History
Date
Name
Owned For
Owner Type
Purchase Details
Closed on
Nov 9, 2016
Sold by
Kirkland Andesite Npl
Bought by
Espinola Properties Ll
Current Estimated Value
Home Financials for this Owner
Home Financials are based on the most recent Mortgage that was taken out on this home.
Original Mortgage
$202,500
Outstanding Balance
$162,572
Interest Rate
3.42%
Mortgage Type
New Conventional
Estimated Equity
$482,701
Purchase Details
Closed on
Jul 5, 2016
Sold by
Garay Christian and Andesite Npl Kirkland
Bought by
Andesite Npl Kirkland
Purchase Details
Closed on
Feb 3, 2006
Sold by
Wiroll Ft and Wiroll
Bought by
Garay Christian
Home Financials for this Owner
Home Financials are based on the most recent Mortgage that was taken out on this home.
Original Mortgage
$269,600
Interest Rate
6.31%
Mortgage Type
Purchase Money Mortgage
Purchase Details
Closed on
May 18, 2005
Sold by
Wiroll Michael H and Wiroll Stacy F
Bought by
Wiroll Jr Tr Michael H and Wiroll Stacy Fisher
Purchase Details
Closed on
Jul 31, 1997
Sold by
Bryant Alan P
Bought by
Wiroll Michael H
Create a Home Valuation Report for This Property
The Home Valuation Report is an in-depth analysis detailing your home's value as well as a comparison with similar homes in the area
Home Values in the Area
Average Home Value in this Area
Purchase History
| Date | Buyer | Sale Price | Title Company |
|---|---|---|---|
| Espinola Properties Ll | $250,000 | -- | |
| Andesite Npl Kirkland | $250,000 | -- | |
| Kirkland Andesite Npl | $250,000 | -- | |
| Garay Christian | $337,000 | -- | |
| Garay Christian | $337,000 | -- | |
| Wiroll Jr Tr Michael H | -- | -- | |
| Wiroll Jr Tr Michael H | -- | -- | |
| Wiroll Michael H | $102,500 | -- | |
| Wiroll Michael H | $102,500 | -- |
Source: Public Records
Mortgage History
| Date | Status | Borrower | Loan Amount |
|---|---|---|---|
| Open | Espinola Properties Ll | $202,500 | |
| Closed | Wiroll Michael H | $202,500 | |
| Previous Owner | Garay Christian | $269,600 |
Source: Public Records
Tax History
| Year | Tax Paid | Tax Assessment Tax Assessment Total Assessment is a certain percentage of the fair market value that is determined by local assessors to be the total taxable value of land and additions on the property. | Land | Improvement |
|---|---|---|---|---|
| 2025 | $7,033 | $612,600 | $124,400 | $488,200 |
| 2024 | $6,838 | $574,100 | $127,000 | $447,100 |
| 2023 | $6,632 | $534,000 | $106,300 | $427,700 |
| 2022 | $6,160 | $485,400 | $96,600 | $388,800 |
| 2021 | $5,346 | $397,200 | $84,000 | $313,200 |
| 2020 | $4,931 | $369,100 | $84,000 | $285,100 |
| 2019 | $4,729 | $336,800 | $73,300 | $263,500 |
| 2018 | $4,330 | $300,900 | $69,800 | $231,100 |
| 2017 | $4,154 | $278,400 | $66,700 | $211,700 |
| 2016 | $3,782 | $249,500 | $57,300 | $192,200 |
| 2015 | $3,596 | $232,300 | $57,300 | $175,000 |
| 2013 | $3,278 | $218,400 | $72,800 | $145,600 |
Source: Public Records
Map
Nearby Homes
- 158 Concord St
- 88 Perry St
- 234 Nesmith St Unit 8
- 44 Hanks St
- 200 Rogers St Unit 6
- 39 Groves Ave
- 189 Charles St
- 313 Nesmith St
- 31 Merrill St
- 42 Pentucket Ave
- 10 Kearney Square Unit 407
- 192 1st St
- 5 Floyd St
- 3 Vernon St
- 30 Market St Unit 7
- 810 Lawrence St Unit C
- 9 Central St Unit 601
- 9 Central St Unit 602
- 94 1st St Unit 10
- 23-33 Middle St Unit 6
Your Personal Tour Guide
Ask me questions while you tour the home.