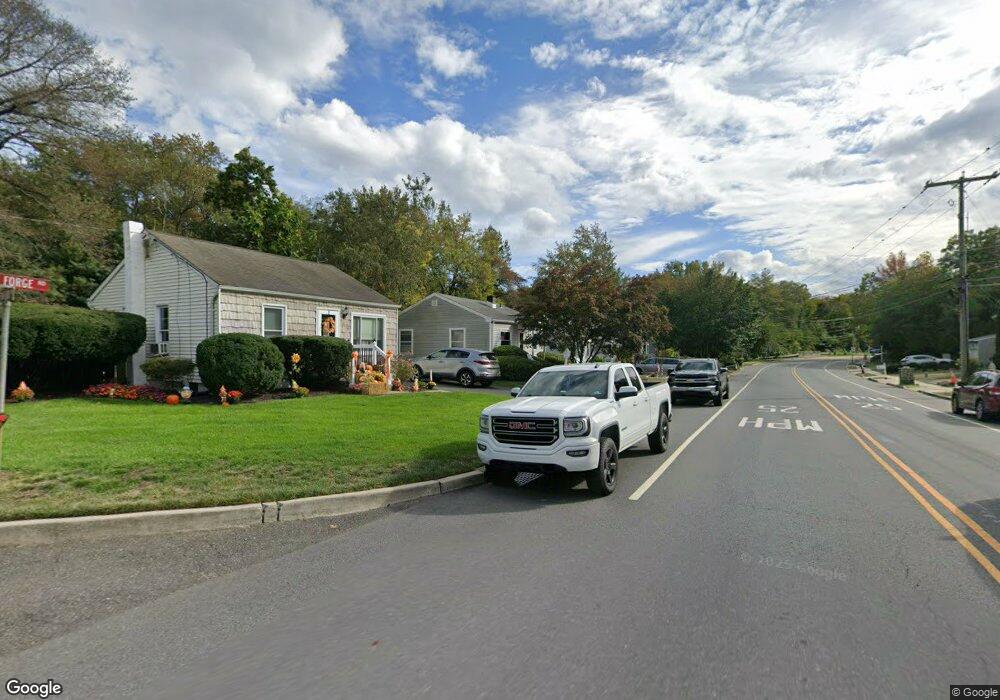
23 Old Forge Rd Helmetta, NJ 08828
Estimated Value: $429,625 - $493,000
Studio
--
Bath
1,296
Sq Ft
$358/Sq Ft
Est. Value
About This Home
This home is located at 23 Old Forge Rd, Helmetta, NJ 08828 and is currently estimated at $464,406, approximately $358 per square foot. 23 Old Forge Rd is a home located in Middlesex County with nearby schools including G. Austin Schoenly Elementary School, E. Raymond Appleby Elementary School, and Spotswood Memorial School.
Ownership History
Date
Name
Owned For
Owner Type
Purchase Details
Closed on
Jun 17, 2015
Sold by
Cranga James John and Cranga Lynn Marie
Bought by
Cranga James John and Cranga Lynn Marie
Current Estimated Value
Home Financials for this Owner
Home Financials are based on the most recent Mortgage that was taken out on this home.
Original Mortgage
$153,850
Outstanding Balance
$119,500
Interest Rate
3.83%
Mortgage Type
New Conventional
Estimated Equity
$344,906
Purchase Details
Closed on
May 12, 2000
Sold by
Vandeursen Richard
Bought by
Cranga James and Cranga Jamey
Home Financials for this Owner
Home Financials are based on the most recent Mortgage that was taken out on this home.
Original Mortgage
$114,008
Interest Rate
8.19%
Mortgage Type
FHA
Purchase Details
Closed on
Jan 23, 1997
Sold by
Hein Bruce
Bought by
Vandeursen Richard
Create a Home Valuation Report for This Property
The Home Valuation Report is an in-depth analysis detailing your home's value as well as a comparison with similar homes in the area
Home Values in the Area
Average Home Value in this Area
Purchase History
| Date | Buyer | Sale Price | Title Company |
|---|---|---|---|
| Cranga James John | -- | Attorney | |
| Cranga James | $115,000 | -- | |
| Vandeursen Richard | $111,000 | -- |
Source: Public Records
Mortgage History
| Date | Status | Borrower | Loan Amount |
|---|---|---|---|
| Open | Cranga James John | $153,850 | |
| Closed | Cranga James | $114,008 |
Source: Public Records
Tax History
| Year | Tax Paid | Tax Assessment Tax Assessment Total Assessment is a certain percentage of the fair market value that is determined by local assessors to be the total taxable value of land and additions on the property. | Land | Improvement |
|---|---|---|---|---|
| 2025 | $6,971 | $205,700 | $90,300 | $115,400 |
| 2024 | $6,710 | $205,700 | $90,300 | $115,400 |
| 2023 | $6,710 | $205,700 | $90,300 | $115,400 |
| 2022 | $6,650 | $205,700 | $90,300 | $115,400 |
| 2021 | $4,331 | $205,700 | $90,300 | $115,400 |
| 2020 | $6,299 | $205,700 | $90,300 | $115,400 |
| 2019 | $6,354 | $205,700 | $90,300 | $115,400 |
| 2018 | $6,272 | $205,700 | $90,300 | $115,400 |
| 2017 | $6,157 | $205,700 | $90,300 | $115,400 |
| 2016 | $5,912 | $205,700 | $90,300 | $115,400 |
| 2015 | $5,646 | $205,700 | $90,300 | $115,400 |
| 2014 | $5,581 | $205,700 | $90,300 | $115,400 |
Source: Public Records
Map
Nearby Homes
- 15 Sutton Place
- 18 Avenue B
- 40 Avenue I
- 312 Raintree Ct
- 7 Lake Ave
- 38 Avenue I
- 6 Holly Manor Ct
- 20 Borghaus Rd
- 1007 Meadow Ct
- 1306 Stoneridge Cir
- 9 Redwood Ct
- 1305 Stoneridge Cir
- 21 Rieder Rd
- 2710 Ridgefield Ct Unit 2710
- 144 Libby Ct
- 2308 Candlelight Ct Unit 2308
- 0-0 Sommerdale St
- 2402 Candlelight Ct Unit 2402
- 139 Village Dr W
- 92 Main St
Your Personal Tour Guide
Ask me questions while you tour the home.