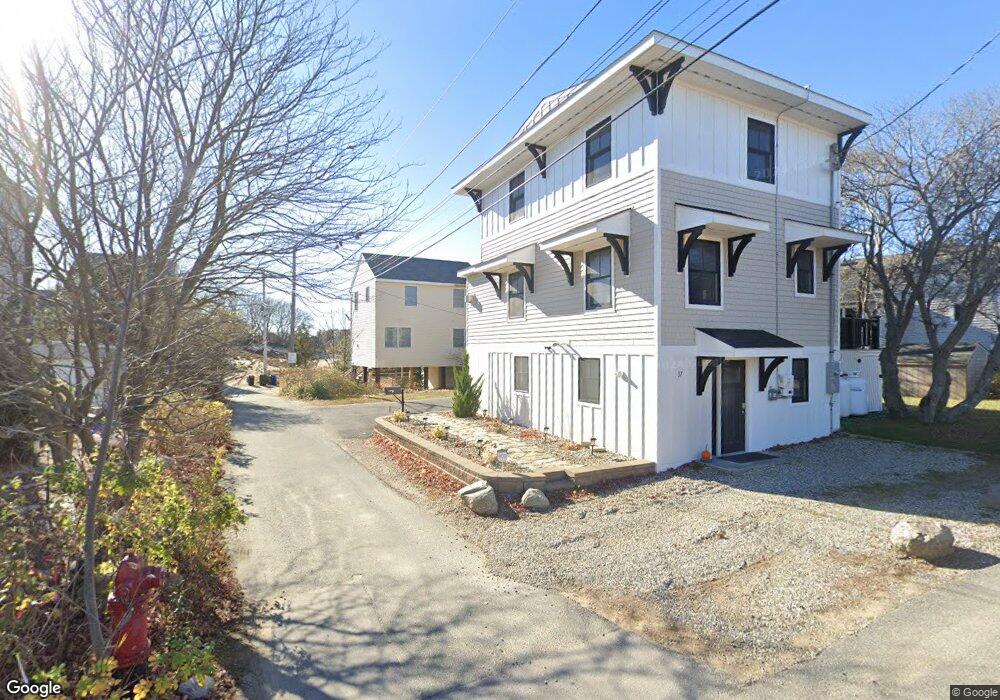
23 Old Point Rd Newbury, MA 01951
Estimated Value: $672,000 - $845,000
3
Beds
1
Bath
770
Sq Ft
$998/Sq Ft
Est. Value
About This Home
This home is located at 23 Old Point Rd, Newbury, MA 01951 and is currently estimated at $768,477, approximately $998 per square foot. 23 Old Point Rd is a home with nearby schools including Triton Regional High School, River Valley Charter School, and Immaculate Conception School.
Ownership History
Date
Name
Owned For
Owner Type
Purchase Details
Closed on
Dec 9, 2016
Sold by
Noonan William T and Noonan Jean R
Bought by
William T Noonan Ft and Noonan
Current Estimated Value
Purchase Details
Closed on
Feb 15, 2011
Sold by
Noonan William T and Noonan Jean R
Bought by
Old Point Road Rt and Noonan
Purchase Details
Closed on
Feb 6, 1963
Bought by
Old Point Rd Rt
Create a Home Valuation Report for This Property
The Home Valuation Report is an in-depth analysis detailing your home's value as well as a comparison with similar homes in the area
Home Values in the Area
Average Home Value in this Area
Purchase History
| Date | Buyer | Sale Price | Title Company |
|---|---|---|---|
| William T Noonan Ft | -- | -- | |
| William T Noonan Ft | -- | -- | |
| Noonan William T | -- | -- | |
| Noonan William T | -- | -- | |
| Old Point Road Rt | -- | -- | |
| Old Point Road Rt | -- | -- | |
| Old Point Rd Rt | -- | -- |
Source: Public Records
Tax History Compared to Growth
Tax History
| Year | Tax Paid | Tax Assessment Tax Assessment Total Assessment is a certain percentage of the fair market value that is determined by local assessors to be the total taxable value of land and additions on the property. | Land | Improvement |
|---|---|---|---|---|
| 2025 | $4,340 | $582,500 | $487,600 | $94,900 |
| 2024 | $4,064 | $529,200 | $445,200 | $84,000 |
| 2023 | $4,227 | $487,600 | $371,000 | $116,600 |
| 2022 | $3,779 | $388,400 | $286,200 | $102,200 |
| 2021 | $3,524 | $330,600 | $233,200 | $97,400 |
| 2020 | $3,518 | $320,100 | $233,200 | $86,900 |
| 2019 | $3,421 | $316,500 | $233,200 | $83,300 |
| 2018 | $3,188 | $292,500 | $212,000 | $80,500 |
| 2017 | $3,084 | $290,700 | $212,000 | $78,700 |
| 2016 | $2,853 | $250,300 | $169,600 | $80,700 |
| 2015 | $2,758 | $239,400 | $159,000 | $80,400 |
| 2014 | $2,769 | $244,600 | $159,000 | $85,600 |
Source: Public Records
Map
Nearby Homes
- 44 Old Point Rd
- 2 Plum Island Blvd
- 5 Northern Blvd
- 11 Sunset Dr
- 2 Sunset Dr
- 5 Helena St
- 4 54th St
- 12 53rd St
- 28 & 30 Plum Island Turnpike
- 11 Harbor St
- 65 Plum Island Turnpike
- 12 Barker St
- 10 Meadowview Ln Unit B
- 24 Seaview Ln
- 7 Pine Island Rd
- 33 Union St
- 4 Goodwin Ave
- 144 High Rd
- 1 Lancaster Rd
- 105 High Rd Unit Lot 2