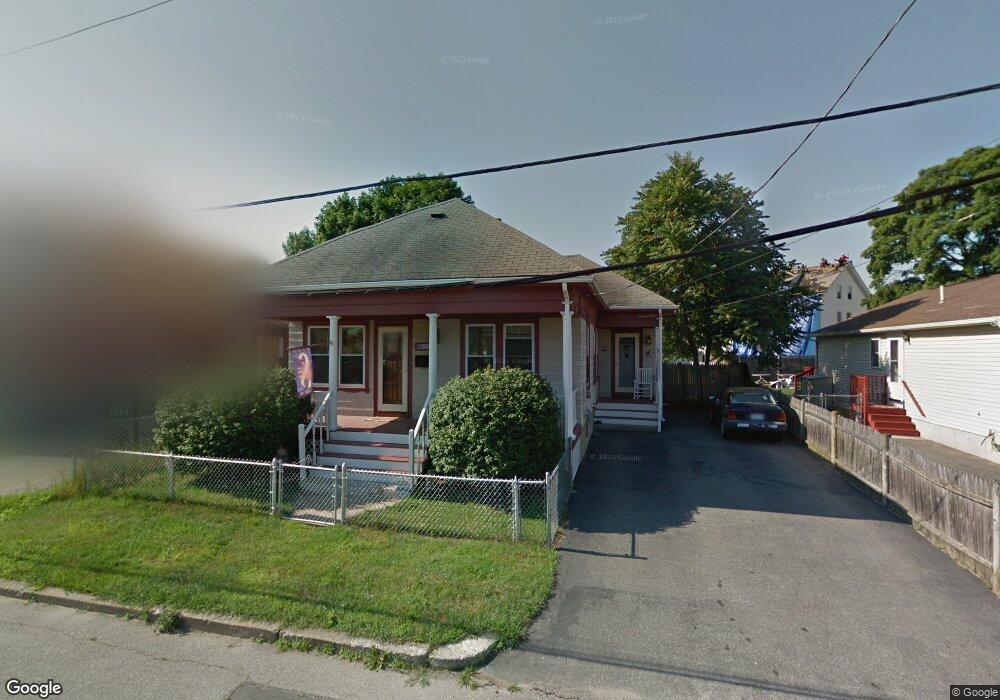
23 Ordway St Pawtucket, RI 02861
Darlington NeighborhoodEstimated Value: $354,000 - $393,000
2
Beds
2
Baths
1,634
Sq Ft
$227/Sq Ft
Est. Value
About This Home
This home is located at 23 Ordway St, Pawtucket, RI 02861 and is currently estimated at $370,411, approximately $226 per square foot. 23 Ordway St is a home located in Providence County with nearby schools including St Cecilia School and Saint Raphael Academy.
Ownership History
Date
Name
Owned For
Owner Type
Purchase Details
Closed on
Jun 30, 2005
Sold by
Dalia Richard and Dalia Wendy
Bought by
Rossi Mary E and Rossi Joseph W
Current Estimated Value
Home Financials for this Owner
Home Financials are based on the most recent Mortgage that was taken out on this home.
Original Mortgage
$210,900
Outstanding Balance
$109,186
Interest Rate
5.73%
Mortgage Type
Purchase Money Mortgage
Estimated Equity
$261,225
Purchase Details
Closed on
May 28, 2002
Sold by
Lotti David R and Lotti Sharyn L
Bought by
Dalia Richard C and Dalia Wendy
Home Financials for this Owner
Home Financials are based on the most recent Mortgage that was taken out on this home.
Original Mortgage
$138,220
Interest Rate
7.01%
Create a Home Valuation Report for This Property
The Home Valuation Report is an in-depth analysis detailing your home's value as well as a comparison with similar homes in the area
Home Values in the Area
Average Home Value in this Area
Purchase History
| Date | Buyer | Sale Price | Title Company |
|---|---|---|---|
| Rossi Mary E | $222,000 | -- | |
| Dalia Richard C | $145,500 | -- |
Source: Public Records
Mortgage History
| Date | Status | Borrower | Loan Amount |
|---|---|---|---|
| Open | Dalia Richard C | $210,900 | |
| Previous Owner | Dalia Richard C | $140,000 | |
| Previous Owner | Dalia Richard C | $138,220 |
Source: Public Records
Tax History Compared to Growth
Tax History
| Year | Tax Paid | Tax Assessment Tax Assessment Total Assessment is a certain percentage of the fair market value that is determined by local assessors to be the total taxable value of land and additions on the property. | Land | Improvement |
|---|---|---|---|---|
| 2025 | $3,402 | $258,700 | $122,900 | $135,800 |
| 2024 | $3,192 | $258,700 | $122,900 | $135,800 |
| 2023 | $3,163 | $186,700 | $76,800 | $109,900 |
| 2022 | $3,095 | $186,700 | $76,800 | $109,900 |
| 2021 | $3,095 | $186,700 | $76,800 | $109,900 |
| 2020 | $2,856 | $136,700 | $60,700 | $76,000 |
| 2019 | $2,856 | $136,700 | $60,700 | $76,000 |
| 2018 | $2,752 | $136,700 | $60,700 | $76,000 |
| 2017 | $2,517 | $110,800 | $49,700 | $61,100 |
| 2016 | $2,425 | $110,800 | $49,700 | $61,100 |
| 2015 | $2,425 | $110,800 | $49,700 | $61,100 |
| 2014 | $2,703 | $117,200 | $49,700 | $67,500 |
Source: Public Records
Map
Nearby Homes