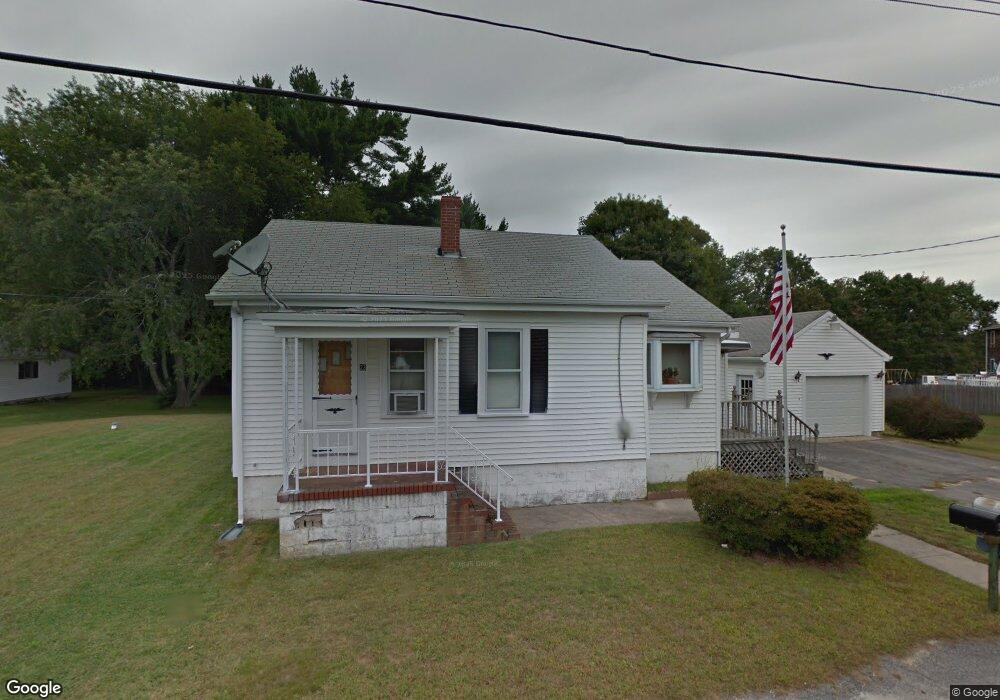
23 Osborn St Westport, MA 02790
North Westport NeighborhoodEstimated Value: $330,000 - $436,000
2
Beds
1
Bath
814
Sq Ft
$470/Sq Ft
Est. Value
About This Home
This home is located at 23 Osborn St, Westport, MA 02790 and is currently estimated at $382,710, approximately $470 per square foot. 23 Osborn St is a home located in Bristol County with nearby schools including Alice A. Macomber Primary School, Westport Elementary School, and Westport Middle-High School.
Ownership History
Date
Name
Owned For
Owner Type
Purchase Details
Closed on
Dec 14, 2007
Sold by
Yergeau Bernadette B and Barrette Janice J
Bought by
Cournoyer Richard R
Current Estimated Value
Home Financials for this Owner
Home Financials are based on the most recent Mortgage that was taken out on this home.
Original Mortgage
$187,200
Outstanding Balance
$118,490
Interest Rate
6.3%
Mortgage Type
Purchase Money Mortgage
Estimated Equity
$264,220
Purchase Details
Closed on
Jun 18, 2004
Sold by
Yergeau Bernadette B
Bought by
Yergeau Bernadette B and Barrette Janice J
Create a Home Valuation Report for This Property
The Home Valuation Report is an in-depth analysis detailing your home's value as well as a comparison with similar homes in the area
Home Values in the Area
Average Home Value in this Area
Purchase History
| Date | Buyer | Sale Price | Title Company |
|---|---|---|---|
| Cournoyer Richard R | $208,000 | -- | |
| Yergeau Bernadette B | -- | -- |
Source: Public Records
Mortgage History
| Date | Status | Borrower | Loan Amount |
|---|---|---|---|
| Open | Yergeau Bernadette B | $187,200 | |
| Previous Owner | Yergeau Bernadette B | $88,000 |
Source: Public Records
Tax History
| Year | Tax Paid | Tax Assessment Tax Assessment Total Assessment is a certain percentage of the fair market value that is determined by local assessors to be the total taxable value of land and additions on the property. | Land | Improvement |
|---|---|---|---|---|
| 2025 | $1,986 | $266,600 | $143,600 | $123,000 |
| 2024 | $1,968 | $254,600 | $133,100 | $121,500 |
| 2023 | $1,900 | $232,800 | $120,700 | $112,100 |
| 2022 | $1,793 | $211,400 | $114,700 | $96,700 |
| 2021 | $0 | $200,700 | $104,200 | $96,500 |
| 2020 | $0 | $191,300 | $94,800 | $96,500 |
| 2019 | $1,582 | $191,300 | $94,800 | $96,500 |
| 2018 | $2,858 | $153,200 | $81,600 | $71,600 |
| 2017 | $2,746 | $157,800 | $87,200 | $70,600 |
| 2016 | $1,189 | $150,300 | $82,700 | $67,600 |
| 2015 | $1,243 | $156,800 | $95,000 | $61,800 |
Source: Public Records
Map
Nearby Homes
- 13 3rd Ave
- 16 Lenox Ave
- 116 Gifford Rd
- 15 S Breault St
- 2 Van Buren St
- 0 Hertitage Acres
- 565 Highland Ave
- 100 D Dr
- 82-84 O Dr
- 2 Fieldstone Dr
- 0 American Legion Hwy Unit 73473517
- 2 Winterberry Ln
- 3 Diane Way
- 1276 Old Fall River Rd
- 588 Gifford Rd
- 358 Briggs Rd
- 300 Davis Rd
- 19 Charles Joseph Dr
- 343 Old Bedford Rd
- 2 Donna Marie Dr
Your Personal Tour Guide
Ask me questions while you tour the home.