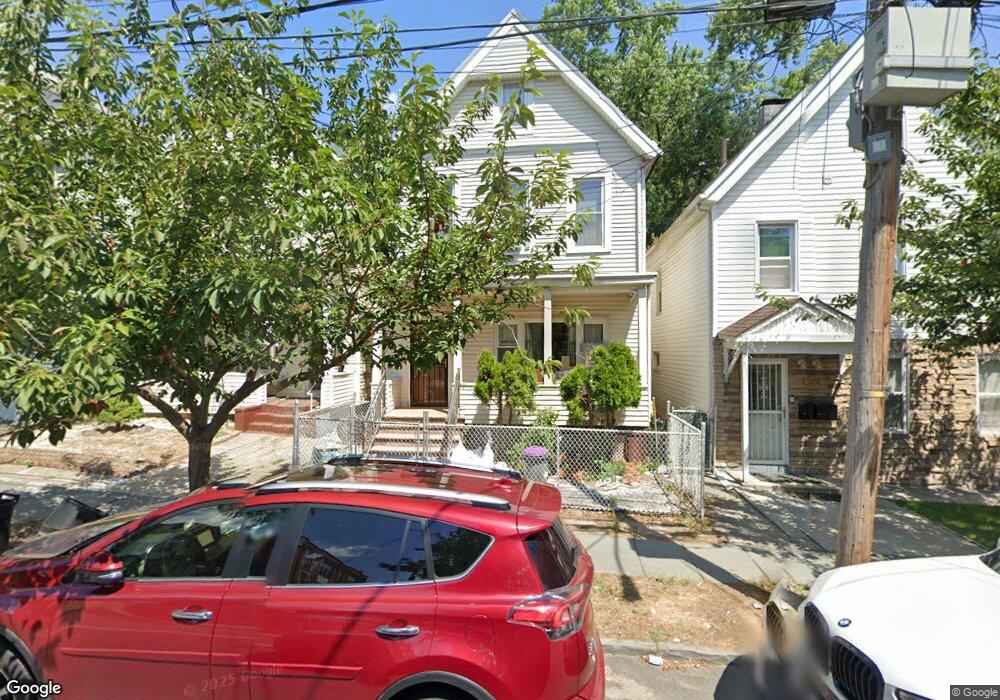
23 Osgood Ave Staten Island, NY 10304
Stapleton NeighborhoodEstimated Value: $522,000 - $573,000
4
Beds
2
Baths
1,056
Sq Ft
$519/Sq Ft
Est. Value
About This Home
This home is located at 23 Osgood Ave, Staten Island, NY 10304 and is currently estimated at $548,355, approximately $519 per square foot. 23 Osgood Ave is a home located in Richmond County with nearby schools including P.S. 78, P.S./I.S. 78Q Early Childhood Center, and I.S. 49 Berta A Dreyfus.
Ownership History
Date
Name
Owned For
Owner Type
Purchase Details
Closed on
Jul 28, 2011
Sold by
Calderon Elisa
Bought by
Chan Choi Hung and Chan Lup Yiu
Current Estimated Value
Purchase Details
Closed on
Dec 7, 2004
Sold by
Calderon Elisa and Calderon Pedro
Bought by
Calderon Elisa
Home Financials for this Owner
Home Financials are based on the most recent Mortgage that was taken out on this home.
Original Mortgage
$228,000
Interest Rate
5.61%
Mortgage Type
New Conventional
Purchase Details
Closed on
Mar 26, 2002
Sold by
First Home Properties Llc
Bought by
Calderon Pedro and Calderon Elisa
Home Financials for this Owner
Home Financials are based on the most recent Mortgage that was taken out on this home.
Original Mortgage
$182,141
Interest Rate
6.8%
Mortgage Type
FHA
Purchase Details
Closed on
Dec 1, 2001
Sold by
Laursen Linda S and Laursen Raymond
Bought by
First Home Properties Llc
Create a Home Valuation Report for This Property
The Home Valuation Report is an in-depth analysis detailing your home's value as well as a comparison with similar homes in the area
Home Values in the Area
Average Home Value in this Area
Purchase History
| Date | Buyer | Sale Price | Title Company |
|---|---|---|---|
| Chan Choi Hung | $155,000 | The Security Title Guarantee | |
| Calderon Elisa | -- | -- | |
| Calderon Pedro | $185,000 | Fidelity National Title Ins | |
| First Home Properties Llc | $110,000 | Fidelity National Title Ins |
Source: Public Records
Mortgage History
| Date | Status | Borrower | Loan Amount |
|---|---|---|---|
| Previous Owner | Calderon Elisa | $228,000 | |
| Previous Owner | Calderon Pedro | $182,141 |
Source: Public Records
Tax History Compared to Growth
Tax History
| Year | Tax Paid | Tax Assessment Tax Assessment Total Assessment is a certain percentage of the fair market value that is determined by local assessors to be the total taxable value of land and additions on the property. | Land | Improvement |
|---|---|---|---|---|
| 2025 | $3,817 | $30,360 | $6,325 | $24,035 |
| 2024 | $4,098 | $32,400 | $5,592 | $26,808 |
| 2023 | $3,859 | $20,402 | $5,944 | $14,458 |
| 2022 | $3,755 | $27,360 | $8,880 | $18,480 |
| 2021 | $3,717 | $23,880 | $8,880 | $15,000 |
| 2020 | $3,519 | $22,080 | $8,880 | $13,200 |
| 2019 | $3,264 | $22,260 | $8,880 | $13,380 |
| 2018 | $3,168 | $17,002 | $6,764 | $10,238 |
| 2017 | $3,140 | $16,873 | $8,296 | $8,577 |
| 2016 | $2,872 | $15,919 | $8,857 | $7,062 |
| 2015 | $2,414 | $15,019 | $7,105 | $7,914 |
| 2014 | $2,414 | $14,169 | $7,084 | $7,085 |
Source: Public Records
Map
Nearby Homes