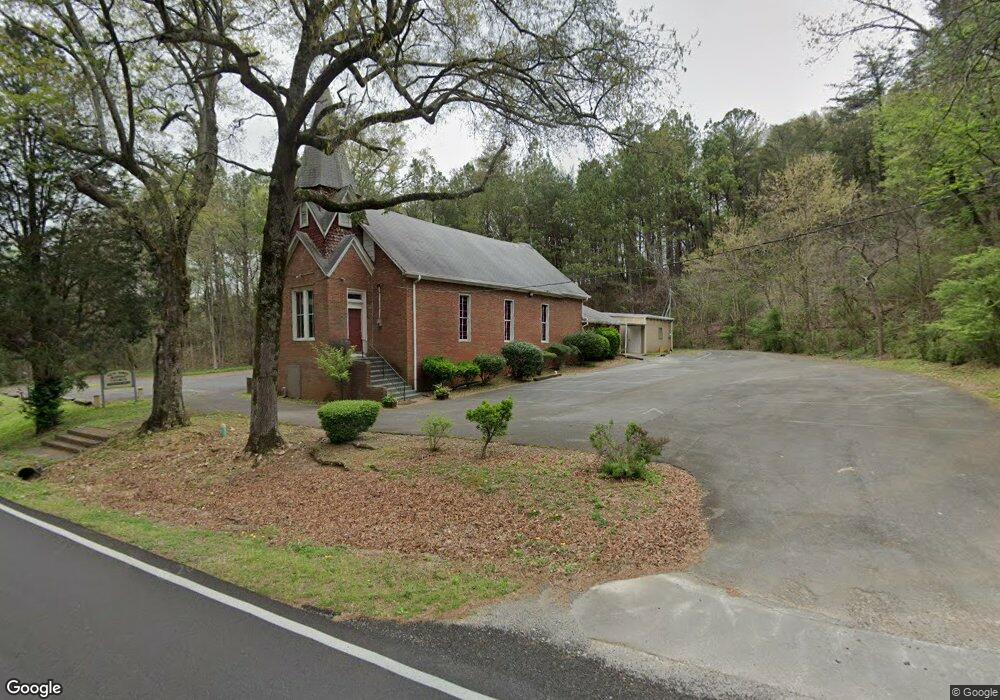
23 Padlock Mountain Rd SW Cave Spring, GA 30124
Estimated Value: $108,797 - $227,000
--
Bed
--
Bath
1,568
Sq Ft
$105/Sq Ft
Est. Value
About This Home
This home is located at 23 Padlock Mountain Rd SW, Cave Spring, GA 30124 and is currently estimated at $164,699, approximately $105 per square foot. 23 Padlock Mountain Rd SW is a home with nearby schools including Coosa Middle School and Coosa High School.
Ownership History
Date
Name
Owned For
Owner Type
Purchase Details
Closed on
Sep 19, 2017
Sold by
Smith Harold W
Bought by
Barnett Theodore and Bunn Steve
Current Estimated Value
Purchase Details
Closed on
Apr 29, 2015
Sold by
Cone Larry
Bought by
Smith Harold W
Purchase Details
Closed on
Dec 29, 2014
Sold by
Cone Debra Scarber
Bought by
Cone Larry
Purchase Details
Closed on
Sep 10, 2009
Sold by
Smith Harold W
Bought by
Cone Debra Scarber
Purchase Details
Closed on
Aug 4, 2005
Sold by
Cone Debra Scarber
Bought by
Smith Harold W
Purchase Details
Closed on
May 24, 2000
Bought by
P and R
Purchase Details
Closed on
Aug 10, 1998
Sold by
Bryant John D
Bought by
Cone Debra Scarber and Larry Cone
Purchase Details
Closed on
Aug 28, 1993
Sold by
Holsey Ruben
Bought by
Bryant John D
Purchase Details
Closed on
Jun 15, 1990
Sold by
Burge Flossie Rosa Mae
Bought by
Holsey Ruben
Purchase Details
Closed on
Jan 1, 1956
Bought by
Burge Flossie Rosa Mae
Create a Home Valuation Report for This Property
The Home Valuation Report is an in-depth analysis detailing your home's value as well as a comparison with similar homes in the area
Home Values in the Area
Average Home Value in this Area
Purchase History
| Date | Buyer | Sale Price | Title Company |
|---|---|---|---|
| Barnett Theodore | -- | -- | |
| Smith Harold W | $24,000 | -- | |
| Cone Larry | -- | -- | |
| Cone Debra Scarber | $24,000 | -- | |
| Smith Harold W | $17,500 | -- | |
| P | $8,000 | -- | |
| Cone Debra Scarber | $8,000 | -- | |
| Bryant John D | $2,600 | -- | |
| Holsey Ruben | $3,000 | -- | |
| Burge Flossie Rosa Mae | -- | -- |
Source: Public Records
Tax History Compared to Growth
Tax History
| Year | Tax Paid | Tax Assessment Tax Assessment Total Assessment is a certain percentage of the fair market value that is determined by local assessors to be the total taxable value of land and additions on the property. | Land | Improvement |
|---|---|---|---|---|
| 2024 | -- | $12,059 | $3,663 | $8,396 |
| 2023 | $252 | $11,338 | $3,330 | $8,008 |
| 2022 | $252 | $9,217 | $2,775 | $6,442 |
| 2021 | $235 | $8,433 | $2,775 | $5,658 |
| 2020 | $208 | $7,490 | $2,220 | $5,270 |
| 2019 | $250 | $9,013 | $2,220 | $6,793 |
| 2018 | $231 | $8,320 | $2,220 | $6,100 |
| 2017 | $29 | $8,004 | $2,220 | $5,784 |
| 2016 | $219 | $7,760 | $2,200 | $5,560 |
| 2015 | -- | $5,312 | $2,200 | $3,112 |
| 2014 | -- | $5,312 | $2,200 | $3,112 |
Source: Public Records
Map
Nearby Homes
- 10 Ridge Rd SW
- 22 River St SW
- 104 Fincher St
- 57 Mill St
- 8876 Cave Spring Rd SW
- 7 Herschel Mize Dr SW
- 7 Herschel Mize Dr
- 8876 Cave Spring
- 0 Mill Rd Unit 10629874
- 0 Mill Rd Unit 7670319
- 5677 Fosters Mill Rd SW
- 5598 Fosters Mill Rd
- 0 Melson Rd SW Unit 7676052
- 0 Melson Rd SW Unit 10636997
- 907 Gadsden Rd SW
- 424 Michael Blvd
- 123 Santa Claus Rd
- 383 Valley Grove Rd
- 100 Lee Ave
- 0 Booger Hollow Rd
- 27 Padlock Mountain Rd SW
- 29 Padlock Mountain Rd SW
- 8 Padlock Mountain Rd SW
- 17 Ridge Rd SW
- 17 Ridge Rd SW
- 17 Ridge Rd SW
- 15 Ridge Rd SW
- 21 Ridge Rd SW
- 21 Ridge Rd SW
- 9 Ridge Rd SW
- 0 Ridge Rd SW Unit 10366822
- 0 Ridge Rd SW Unit 10229709
- 14 Ridge Rd SW
- 23 Ridge Rd SW
- 7 Ridge Rd SW
- 3 Laurel Ln SW
- 4 Laurel Ln SW
- 27 Ridge Rd SW
- 5 Laurel Ln SW
- 2 Valley Rd SW