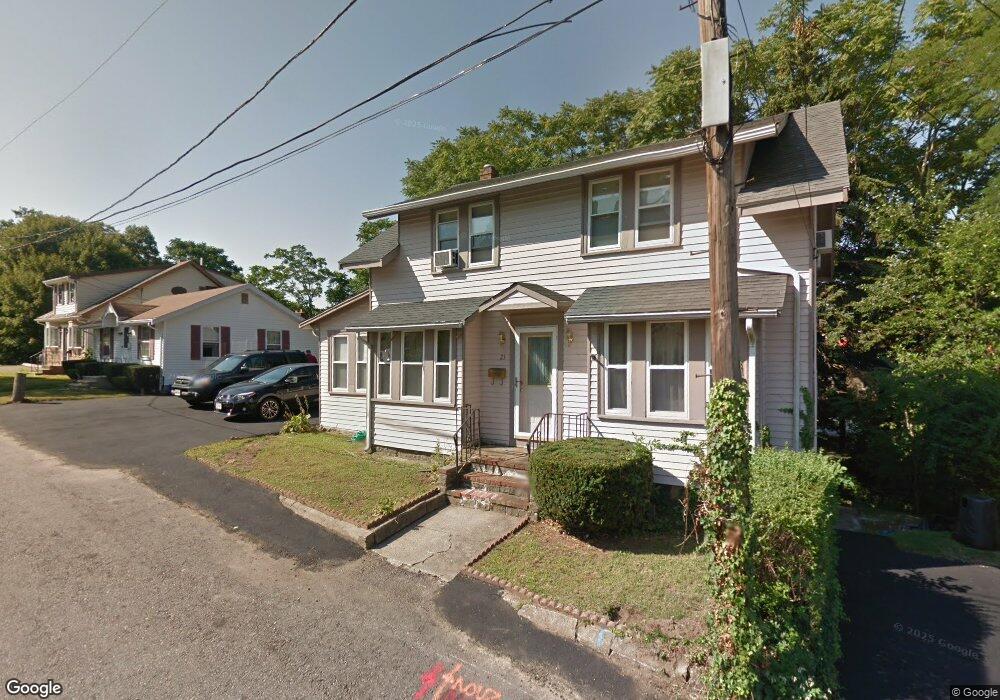
23 Perkins St Quincy, MA 02169
South Quincy NeighborhoodEstimated Value: $673,000 - $743,000
3
Beds
1
Bath
1,860
Sq Ft
$383/Sq Ft
Est. Value
About This Home
This home is located at 23 Perkins St, Quincy, MA 02169 and is currently estimated at $712,807, approximately $383 per square foot. 23 Perkins St is a home located in Norfolk County with nearby schools including Charles A. Bernazzani Elementary School, Central Middle School, and Quincy High School.
Ownership History
Date
Name
Owned For
Owner Type
Purchase Details
Closed on
May 9, 2024
Sold by
Wong Fuk H and Cho Jennifer S
Bought by
Harris Wong Lt and Wong
Current Estimated Value
Purchase Details
Closed on
Apr 25, 1997
Sold by
Mcculley Robert J and Mcculley Linda M
Bought by
Wong Fuk H
Home Financials for this Owner
Home Financials are based on the most recent Mortgage that was taken out on this home.
Original Mortgage
$120,000
Interest Rate
7.77%
Mortgage Type
Purchase Money Mortgage
Create a Home Valuation Report for This Property
The Home Valuation Report is an in-depth analysis detailing your home's value as well as a comparison with similar homes in the area
Home Values in the Area
Average Home Value in this Area
Purchase History
| Date | Buyer | Sale Price | Title Company |
|---|---|---|---|
| Harris Wong Lt | -- | None Available | |
| Harris Wong Lt | -- | None Available | |
| Wong Fuk H | $165,000 | -- | |
| Wong Fuk H | $165,000 | -- |
Source: Public Records
Mortgage History
| Date | Status | Borrower | Loan Amount |
|---|---|---|---|
| Previous Owner | Wong Fuk H | $115,000 | |
| Previous Owner | Wong Fuk H | $120,000 |
Source: Public Records
Tax History
| Year | Tax Paid | Tax Assessment Tax Assessment Total Assessment is a certain percentage of the fair market value that is determined by local assessors to be the total taxable value of land and additions on the property. | Land | Improvement |
|---|---|---|---|---|
| 2025 | $7,134 | $618,700 | $292,700 | $326,000 |
| 2024 | $6,674 | $592,200 | $278,800 | $313,400 |
| 2023 | $6,256 | $562,100 | $265,500 | $296,600 |
| 2022 | $6,166 | $514,700 | $212,400 | $302,300 |
| 2021 | $5,787 | $476,700 | $212,400 | $264,300 |
| 2020 | $5,800 | $466,600 | $212,400 | $254,200 |
| 2019 | $5,722 | $455,900 | $206,200 | $249,700 |
| 2018 | $5,547 | $415,800 | $190,900 | $224,900 |
| 2017 | $5,528 | $390,100 | $181,800 | $208,300 |
| 2016 | $5,132 | $357,400 | $165,300 | $192,100 |
| 2015 | $4,838 | $331,400 | $155,900 | $175,500 |
| 2014 | $4,651 | $313,000 | $155,900 | $157,100 |
Source: Public Records
Map
Nearby Homes
- 230 Willard St Unit 102
- 114 Willard St Unit 4
- 84 Gardiner Rd
- 21 Robertson St
- 41 Wallace Rd
- 39 Cross St
- 149 Reservoir Rd
- 40 Cross St Unit 1
- 440 Granite Ave Unit 201
- 211 Copeland St
- 510 Willard St
- 1 Cityview Ln Unit 707
- 17 Albany St
- 0 Franklin St
- 281 Elmwood Ave
- 12 Nelson St
- 211 West St Unit 11B
- 30 Elmwood Park
- 1185 Brook Rd
- 46 Century Ln
- 21 Perkins St
- 31 Perkins St
- 31 Perkins St Unit SF
- 35 Perkins St
- 28 Perkins St Unit 28
- 190 Willard St
- 15 Perkins St
- 26 Perkins St
- 22 Perkins St
- 32 Perkins St
- 16 Perkins St
- 11 Perkins St
- 11 Perkins St Unit 1
- 42 Rogers St
- 2 Primrose Cir
- 12 Perkins St
- 42R Rogers St
- 9 Perkins St
- 4 Primrose Cir
- 8 Perkins St
Your Personal Tour Guide
Ask me questions while you tour the home.