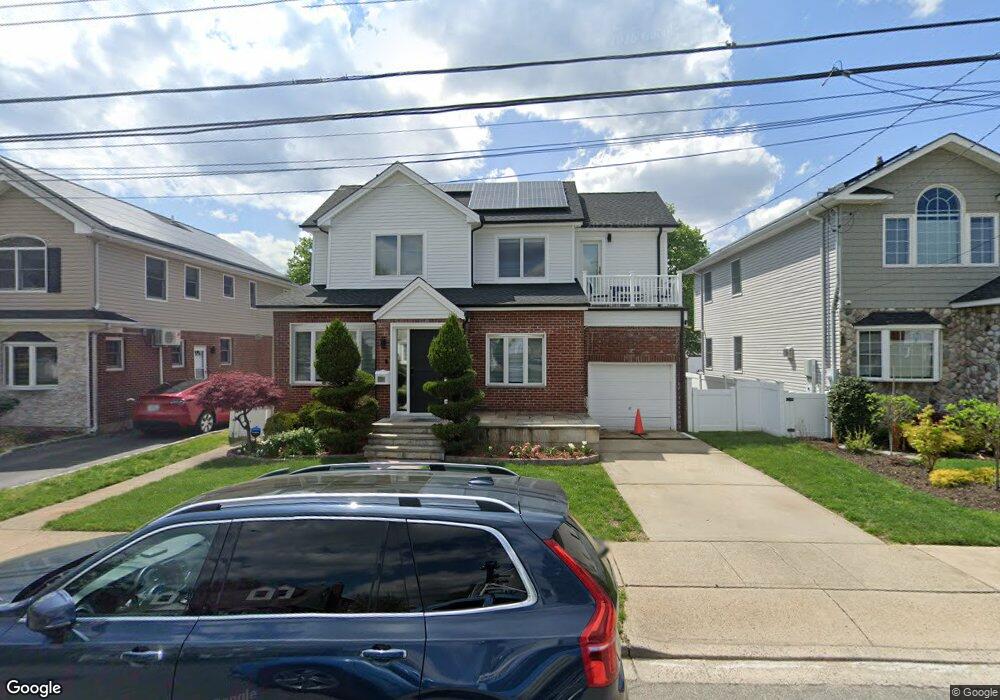
23 Pilgrim St New Hyde Park, NY 11040
Estimated Value: $900,678 - $948,000
3
Beds
1
Bath
1,586
Sq Ft
$583/Sq Ft
Est. Value
About This Home
This home is located at 23 Pilgrim St, New Hyde Park, NY 11040 and is currently estimated at $924,339, approximately $582 per square foot. 23 Pilgrim St is a home located in Nassau County with nearby schools including Notre Dame School.
Ownership History
Date
Name
Owned For
Owner Type
Purchase Details
Closed on
Oct 2, 2013
Sold by
Calabrese Lena and Rocha Lena
Bought by
Chung Heejin and Chung Celine Hyunju
Current Estimated Value
Home Financials for this Owner
Home Financials are based on the most recent Mortgage that was taken out on this home.
Original Mortgage
$483,000
Outstanding Balance
$364,062
Interest Rate
4.58%
Mortgage Type
Purchase Money Mortgage
Estimated Equity
$560,277
Purchase Details
Closed on
Mar 16, 2000
Purchase Details
Closed on
Aug 3, 1998
Sold by
Jane Trusey
Bought by
Calabrese Louis and Calabrese Lena
Create a Home Valuation Report for This Property
The Home Valuation Report is an in-depth analysis detailing your home's value as well as a comparison with similar homes in the area
Home Values in the Area
Average Home Value in this Area
Purchase History
| Date | Buyer | Sale Price | Title Company |
|---|---|---|---|
| Chung Heejin | $537,500 | First Nationwide Of New York | |
| -- | -- | -- | |
| Calabrese Louis | $237,500 | -- |
Source: Public Records
Mortgage History
| Date | Status | Borrower | Loan Amount |
|---|---|---|---|
| Open | Chung Heejin | $483,000 |
Source: Public Records
Tax History Compared to Growth
Tax History
| Year | Tax Paid | Tax Assessment Tax Assessment Total Assessment is a certain percentage of the fair market value that is determined by local assessors to be the total taxable value of land and additions on the property. | Land | Improvement |
|---|---|---|---|---|
| 2025 | $12,463 | $570 | $278 | $292 |
| 2024 | $3,736 | $582 | $284 | $298 |
| 2023 | $12,069 | $611 | $298 | $313 |
| 2022 | $12,069 | $602 | $294 | $308 |
| 2021 | $11,314 | $643 | $313 | $330 |
| 2020 | $12,427 | $875 | $580 | $295 |
| 2019 | $12,444 | $1,132 | $750 | $382 |
| 2018 | $15,129 | $1,132 | $0 | $0 |
| 2017 | $9,029 | $1,092 | $750 | $342 |
| 2016 | $13,033 | $1,092 | $750 | $342 |
| 2015 | $3,810 | $1,092 | $750 | $342 |
| 2014 | $3,810 | $1,092 | $750 | $342 |
| 2013 | $3,621 | $1,092 | $750 | $342 |
Source: Public Records
Map
Nearby Homes