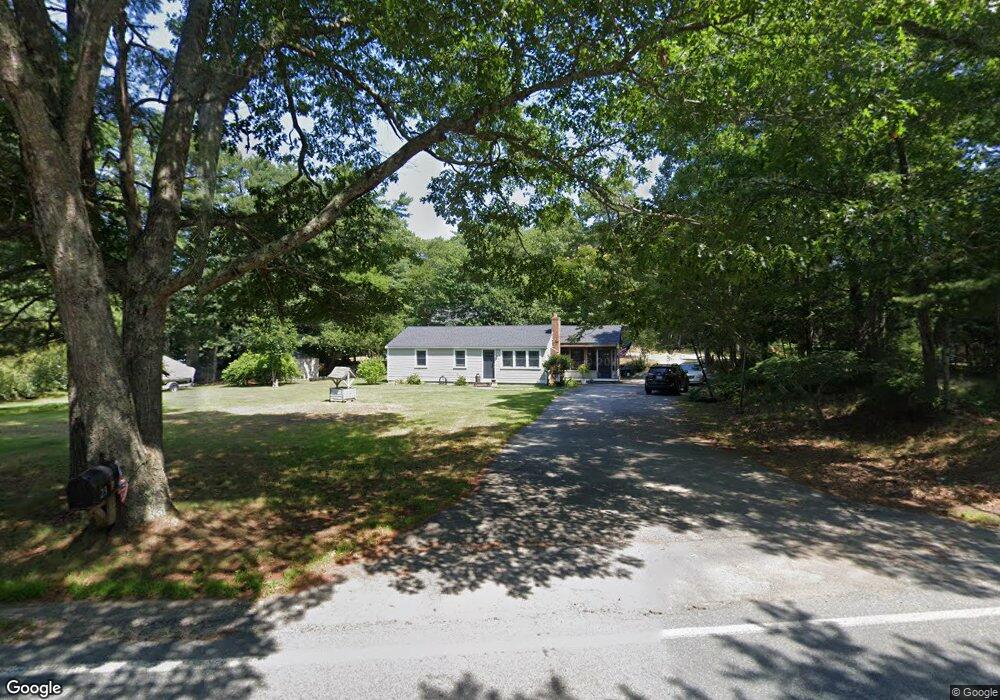
23 Plymouth St Carver, MA 02330
Estimated Value: $495,000 - $566,000
3
Beds
1
Bath
960
Sq Ft
$555/Sq Ft
Est. Value
About This Home
This home is located at 23 Plymouth St, Carver, MA 02330 and is currently estimated at $532,519, approximately $554 per square foot. 23 Plymouth St is a home located in Plymouth County with nearby schools including Carver Elementary School, Carver Middle/High School, and Map Academy Charter School.
Ownership History
Date
Name
Owned For
Owner Type
Purchase Details
Closed on
Mar 29, 2002
Sold by
Martino Anthony P and Martino Deborah J
Bought by
Hutchison Richard J and Hutchison Sandra E
Current Estimated Value
Home Financials for this Owner
Home Financials are based on the most recent Mortgage that was taken out on this home.
Original Mortgage
$189,905
Outstanding Balance
$79,118
Interest Rate
6.88%
Mortgage Type
Purchase Money Mortgage
Estimated Equity
$453,401
Create a Home Valuation Report for This Property
The Home Valuation Report is an in-depth analysis detailing your home's value as well as a comparison with similar homes in the area
Home Values in the Area
Average Home Value in this Area
Purchase History
| Date | Buyer | Sale Price | Title Company |
|---|---|---|---|
| Hutchison Richard J | $199,900 | -- |
Source: Public Records
Mortgage History
| Date | Status | Borrower | Loan Amount |
|---|---|---|---|
| Open | Hutchison Richard J | $189,905 | |
| Previous Owner | Hutchison Richard J | $83,000 | |
| Previous Owner | Hutchison Richard J | $85,000 |
Source: Public Records
Tax History Compared to Growth
Tax History
| Year | Tax Paid | Tax Assessment Tax Assessment Total Assessment is a certain percentage of the fair market value that is determined by local assessors to be the total taxable value of land and additions on the property. | Land | Improvement |
|---|---|---|---|---|
| 2025 | $6,316 | $455,400 | $144,000 | $311,400 |
| 2024 | $6,078 | $428,900 | $141,200 | $287,700 |
| 2023 | $5,899 | $404,300 | $141,200 | $263,100 |
| 2022 | $5,595 | $350,100 | $120,700 | $229,400 |
| 2021 | $5,302 | $313,000 | $107,800 | $205,200 |
| 2020 | $5,083 | $295,700 | $100,800 | $194,900 |
| 2019 | $4,914 | $288,200 | $97,800 | $190,400 |
| 2018 | $4,697 | $266,400 | $97,800 | $168,600 |
| 2017 | $4,228 | $239,000 | $94,100 | $144,900 |
| 2016 | $3,866 | $227,000 | $89,600 | $137,400 |
| 2015 | $3,703 | $217,700 | $89,600 | $128,100 |
| 2014 | $3,792 | $222,900 | $113,300 | $109,600 |
Source: Public Records
Map
Nearby Homes