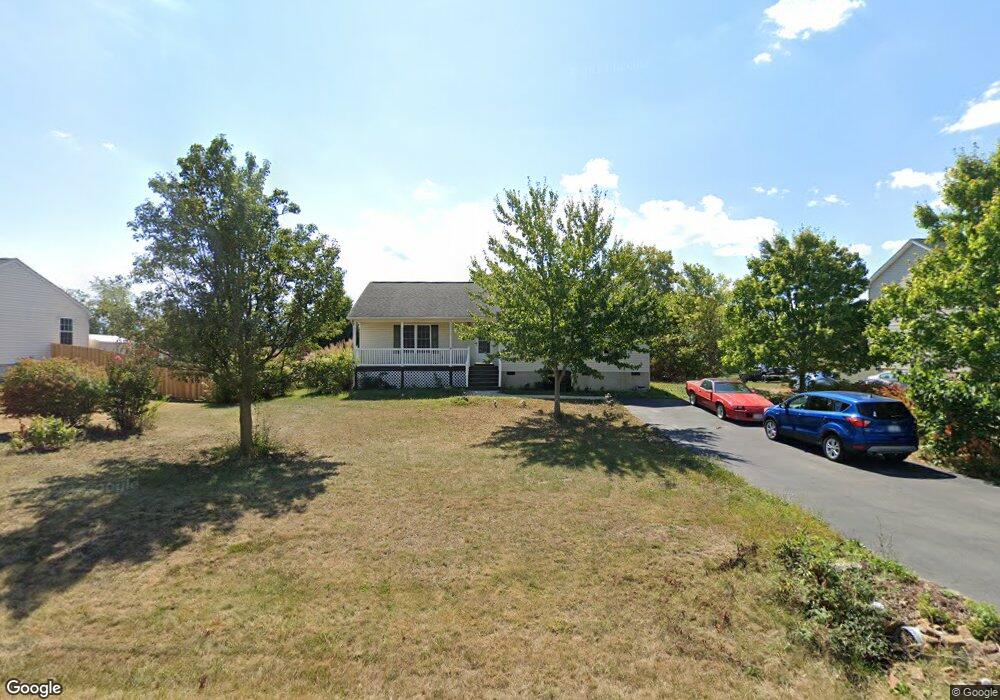
23 Princess Ann Ln Stuarts Draft, VA 24477
Estimated Value: $311,000 - $349,000
3
Beds
2
Baths
1,302
Sq Ft
$248/Sq Ft
Est. Value
About This Home
This home is located at 23 Princess Ann Ln, Stuarts Draft, VA 24477 and is currently estimated at $323,238, approximately $248 per square foot. 23 Princess Ann Ln is a home located in Augusta County with nearby schools including Guy K. Stump Elementary School, Stuarts Draft Middle School, and Stuarts Draft High School.
Ownership History
Date
Name
Owned For
Owner Type
Purchase Details
Closed on
Apr 5, 2021
Sold by
Chaplin Jeffrey B and Prowell Brittany L
Bought by
Chaplin Jeffrey B and Prowell Brittany L
Current Estimated Value
Home Financials for this Owner
Home Financials are based on the most recent Mortgage that was taken out on this home.
Original Mortgage
$183,500
Outstanding Balance
$165,678
Interest Rate
3%
Mortgage Type
Stand Alone Refi Refinance Of Original Loan
Estimated Equity
$157,560
Purchase Details
Closed on
Mar 28, 2005
Sold by
Fitzgerald General Contractor Inc
Bought by
West Scott M and West Crystal R
Home Financials for this Owner
Home Financials are based on the most recent Mortgage that was taken out on this home.
Original Mortgage
$151,019
Interest Rate
5.61%
Mortgage Type
New Conventional
Create a Home Valuation Report for This Property
The Home Valuation Report is an in-depth analysis detailing your home's value as well as a comparison with similar homes in the area
Home Values in the Area
Average Home Value in this Area
Purchase History
| Date | Buyer | Sale Price | Title Company |
|---|---|---|---|
| Chaplin Jeffrey B | -- | None Available | |
| West Scott M | -- | -- |
Source: Public Records
Mortgage History
| Date | Status | Borrower | Loan Amount |
|---|---|---|---|
| Open | Chaplin Jeffrey B | $183,500 | |
| Previous Owner | West Scott M | $151,019 |
Source: Public Records
Tax History Compared to Growth
Tax History
| Year | Tax Paid | Tax Assessment Tax Assessment Total Assessment is a certain percentage of the fair market value that is determined by local assessors to be the total taxable value of land and additions on the property. | Land | Improvement |
|---|---|---|---|---|
| 2025 | $1,341 | $257,900 | $60,000 | $197,900 |
| 2024 | $1,361 | $261,700 | $60,000 | $201,700 |
| 2023 | $1,017 | $161,400 | $45,000 | $116,400 |
| 2022 | $1,017 | $161,400 | $45,000 | $116,400 |
| 2021 | $733 | $161,400 | $45,000 | $116,400 |
| 2020 | $1,017 | $161,400 | $45,000 | $116,400 |
| 2019 | $1,017 | $161,400 | $45,000 | $116,400 |
| 2018 | $941 | $149,288 | $45,000 | $104,288 |
| 2017 | $866 | $149,288 | $45,000 | $104,288 |
| 2016 | $866 | $149,288 | $45,000 | $104,288 |
| 2015 | $749 | $149,288 | $45,000 | $104,288 |
| 2014 | $749 | $149,288 | $45,000 | $104,288 |
| 2013 | $749 | $156,000 | $55,000 | $101,000 |
Source: Public Records
Map
Nearby Homes
- 176 Locust Grove Ln
- 2735 Stuarts Draft Hwy
- 45 Gemstone Dr
- 203 Howardsville Turnpike
- 62 Fossil Dr
- 68 Fossil Dr
- 66 Fossil Dr
- 81 Meriwether Cir
- 51 Meriwether Cir
- 39 Forest Springs Dr
- 3318 Stuarts Draft Hwy
- 87 Falling Rock Dr
- TBD Sweet Oaks Ln
- 0 Johnson Dr
- 112 Arrowhead Ln
- 38 Greenbriar Ln
- 114 Jaspers Ln
- 150 Falling Rock Dr
- 57 Greenbriar Ln
- 253 Forest Springs Dr
- 19 Princess Ann Ln
- 33 Princess Ann Ln
- 11 Princess Ann Ln
- 39 Princess Ann Ln
- 26 Princess Ann Ln
- 21 Princess Ln
- 18 Princess Ann Ln
- 5 Princess Ann Ln
- 49 Princess Ann Ln
- 10 Princess Ann Ln
- 22 Princess Ln
- 3 Princess Ann Ln
- 57 Princess Ann Ln
- 50 Princess Ann Ln
- 6 Princess Ann Ln
- 2 Princess Ann Ln
- 327 Wayne Ave
- 333 Wayne Ave
- 319 Wayne Ave
- 61 Princess Ann Ln