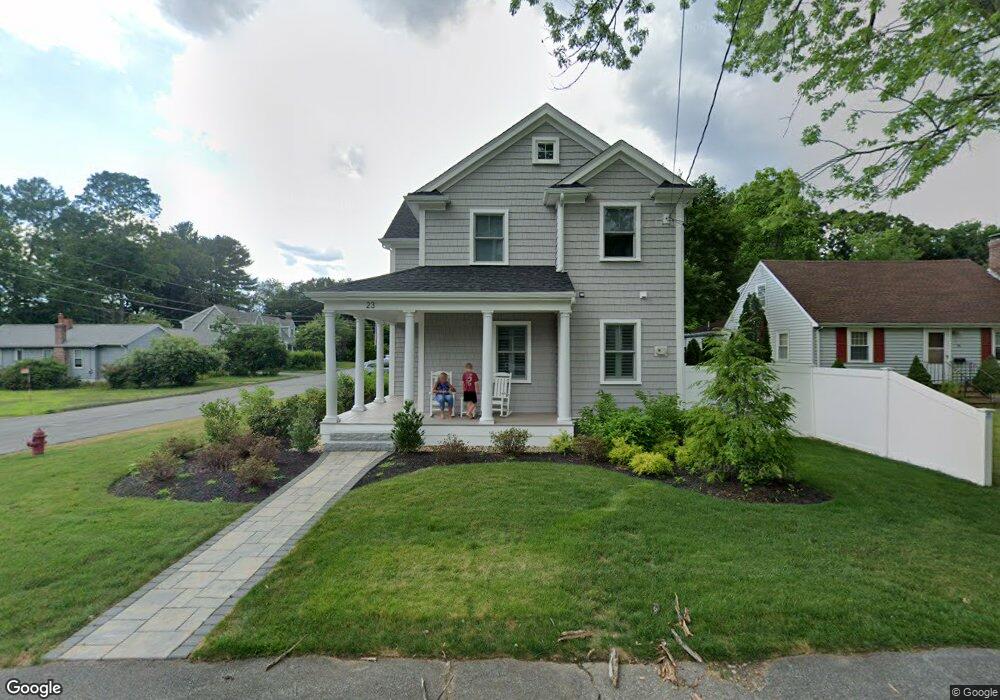
23 Proctor St Natick, MA 01760
Estimated Value: $1,578,000 - $1,984,000
5
Beds
5
Baths
3,359
Sq Ft
$519/Sq Ft
Est. Value
About This Home
This home is located at 23 Proctor St, Natick, MA 01760 and is currently estimated at $1,742,688, approximately $518 per square foot. 23 Proctor St is a home located in Middlesex County with nearby schools including Natick High School, Johnson Elementary School, and J F Kennedy Middle School.
Ownership History
Date
Name
Owned For
Owner Type
Purchase Details
Closed on
Apr 2, 2021
Sold by
23 Proctor Street Rt Llc
Bought by
Stachura David A and Stachura Ericka
Current Estimated Value
Home Financials for this Owner
Home Financials are based on the most recent Mortgage that was taken out on this home.
Original Mortgage
$975,000
Outstanding Balance
$877,451
Interest Rate
2.8%
Mortgage Type
Purchase Money Mortgage
Estimated Equity
$865,237
Purchase Details
Closed on
Feb 8, 2018
Sold by
School Sophia A
Bought by
Sophia A School Irt
Create a Home Valuation Report for This Property
The Home Valuation Report is an in-depth analysis detailing your home's value as well as a comparison with similar homes in the area
Home Values in the Area
Average Home Value in this Area
Purchase History
| Date | Buyer | Sale Price | Title Company |
|---|---|---|---|
| Stachura David A | $1,300,000 | None Available | |
| Sophia A School Irt | -- | -- |
Source: Public Records
Mortgage History
| Date | Status | Borrower | Loan Amount |
|---|---|---|---|
| Open | Stachura David A | $975,000 |
Source: Public Records
Tax History
| Year | Tax Paid | Tax Assessment Tax Assessment Total Assessment is a certain percentage of the fair market value that is determined by local assessors to be the total taxable value of land and additions on the property. | Land | Improvement |
|---|---|---|---|---|
| 2025 | $19,039 | $1,591,900 | $429,400 | $1,162,500 |
| 2024 | $18,362 | $1,497,700 | $404,100 | $1,093,600 |
| 2023 | $17,182 | $1,359,300 | $388,600 | $970,700 |
| 2022 | $16,556 | $1,241,100 | $352,900 | $888,200 |
| 2021 | $6,455 | $474,300 | $332,700 | $141,600 |
| 2020 | $6,491 | $476,900 | $317,600 | $159,300 |
| 2019 | $6,061 | $476,900 | $317,600 | $159,300 |
| 2018 | $5,341 | $409,300 | $302,500 | $106,800 |
| 2017 | $5,012 | $371,500 | $258,100 | $113,400 |
| 2016 | $4,740 | $349,300 | $237,100 | $112,200 |
| 2015 | $4,704 | $340,400 | $237,100 | $103,300 |
Source: Public Records
Map
Nearby Homes
- 1 Fern St
- 28 Sylvester Rd
- 79 Speen St
- 5 Lanes End
- 16 West St
- 62 Oakland St
- 46 Silver Hill Ln Unit 1
- 36 Silver Hill Ln Unit 21
- 26 Wellesley Ave Unit B
- 3 Silver Hill Ln Unit 6
- 1 Post Oak Ln Unit 19
- 25 Forest Ave
- 89 W Central St
- 216-218 S Main St
- 34 Walden Dr Unit 5
- 8 Walden Dr Unit 13
- 7 Allison Way Unit 7
- 6 Floral Avenue Extension
- 11 Morgan Dr Unit 404
- 58 W Central St
Your Personal Tour Guide
Ask me questions while you tour the home.